¶ Grafana
Grafana is the open source analytics & monitoring solution for every database. Within the Smart Parks Stack this application is used to monitor and analyse data within the Stack. As Grafana is only a data visualisation tool, it does not manage or store any of the databases or data sources itself. To use dashboards, Grafana needs to have access to a data source. Various example dashboard have been created. For example to display data from OpenCollar Edge devices, Rain Gauges and Tank level monitoring sensors.
¶ Grafana - dashboards
Various example dashboard have been created. For example to display data from OpenCollar Edge devices, Rain Gauges and Tank level monitoring sensors.
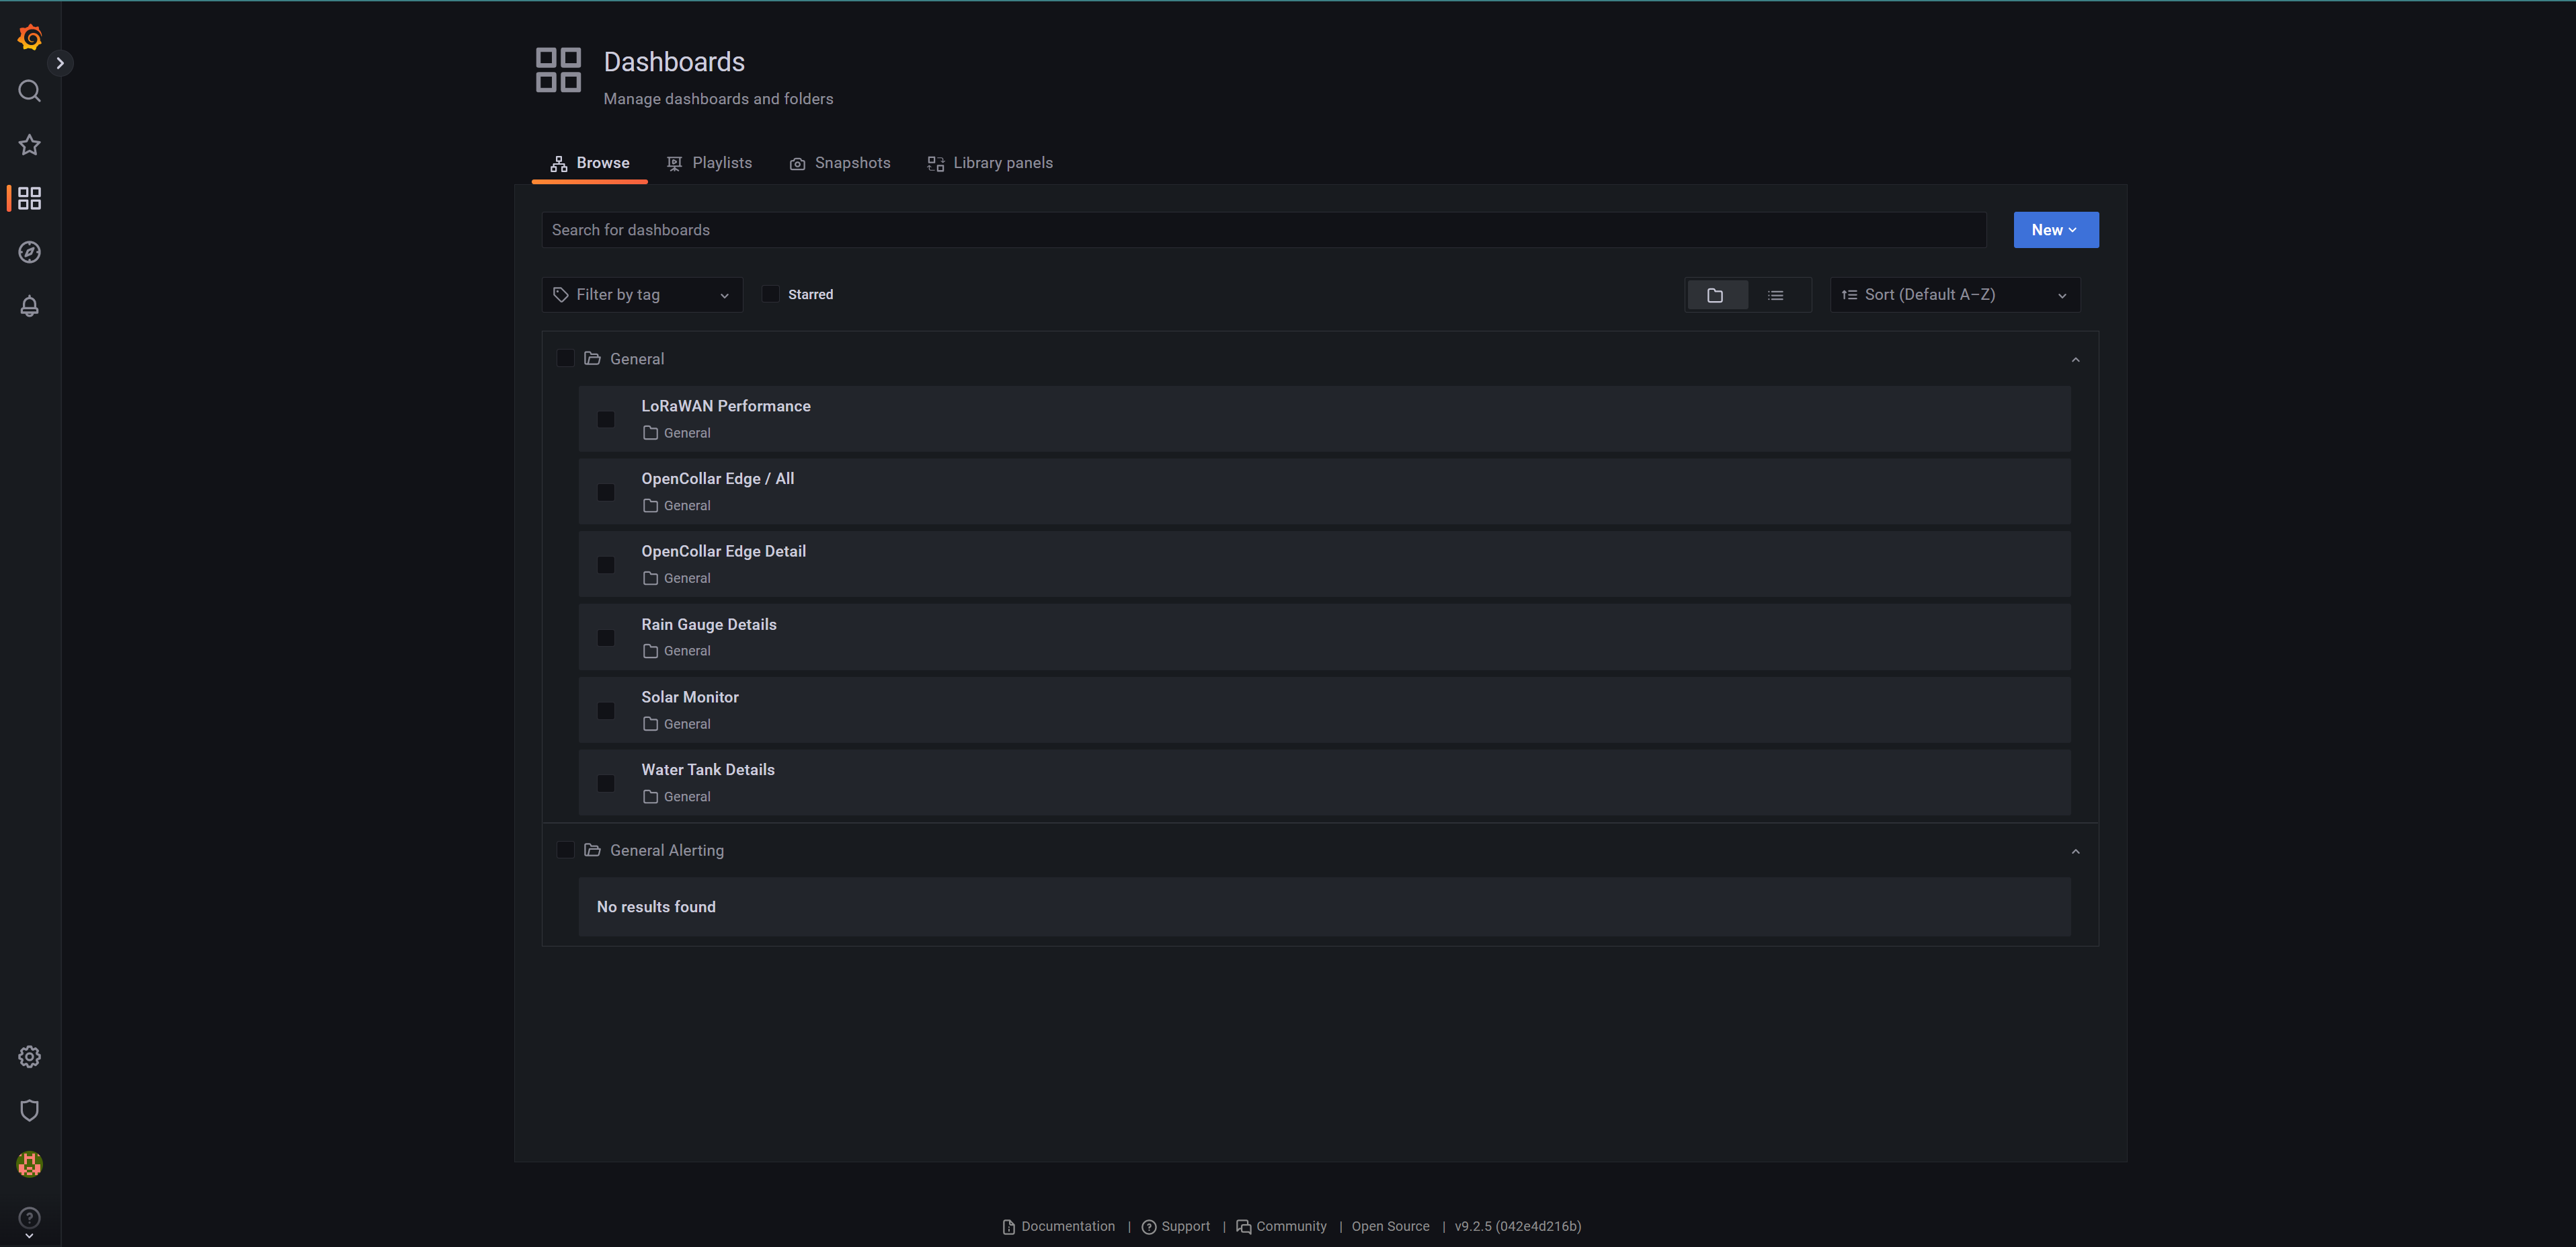
- OpenCollar Edge
- Rain Gauge Details
- Water Tank Details
- LoRaWAN Performance
¶ OpenCollar Edge
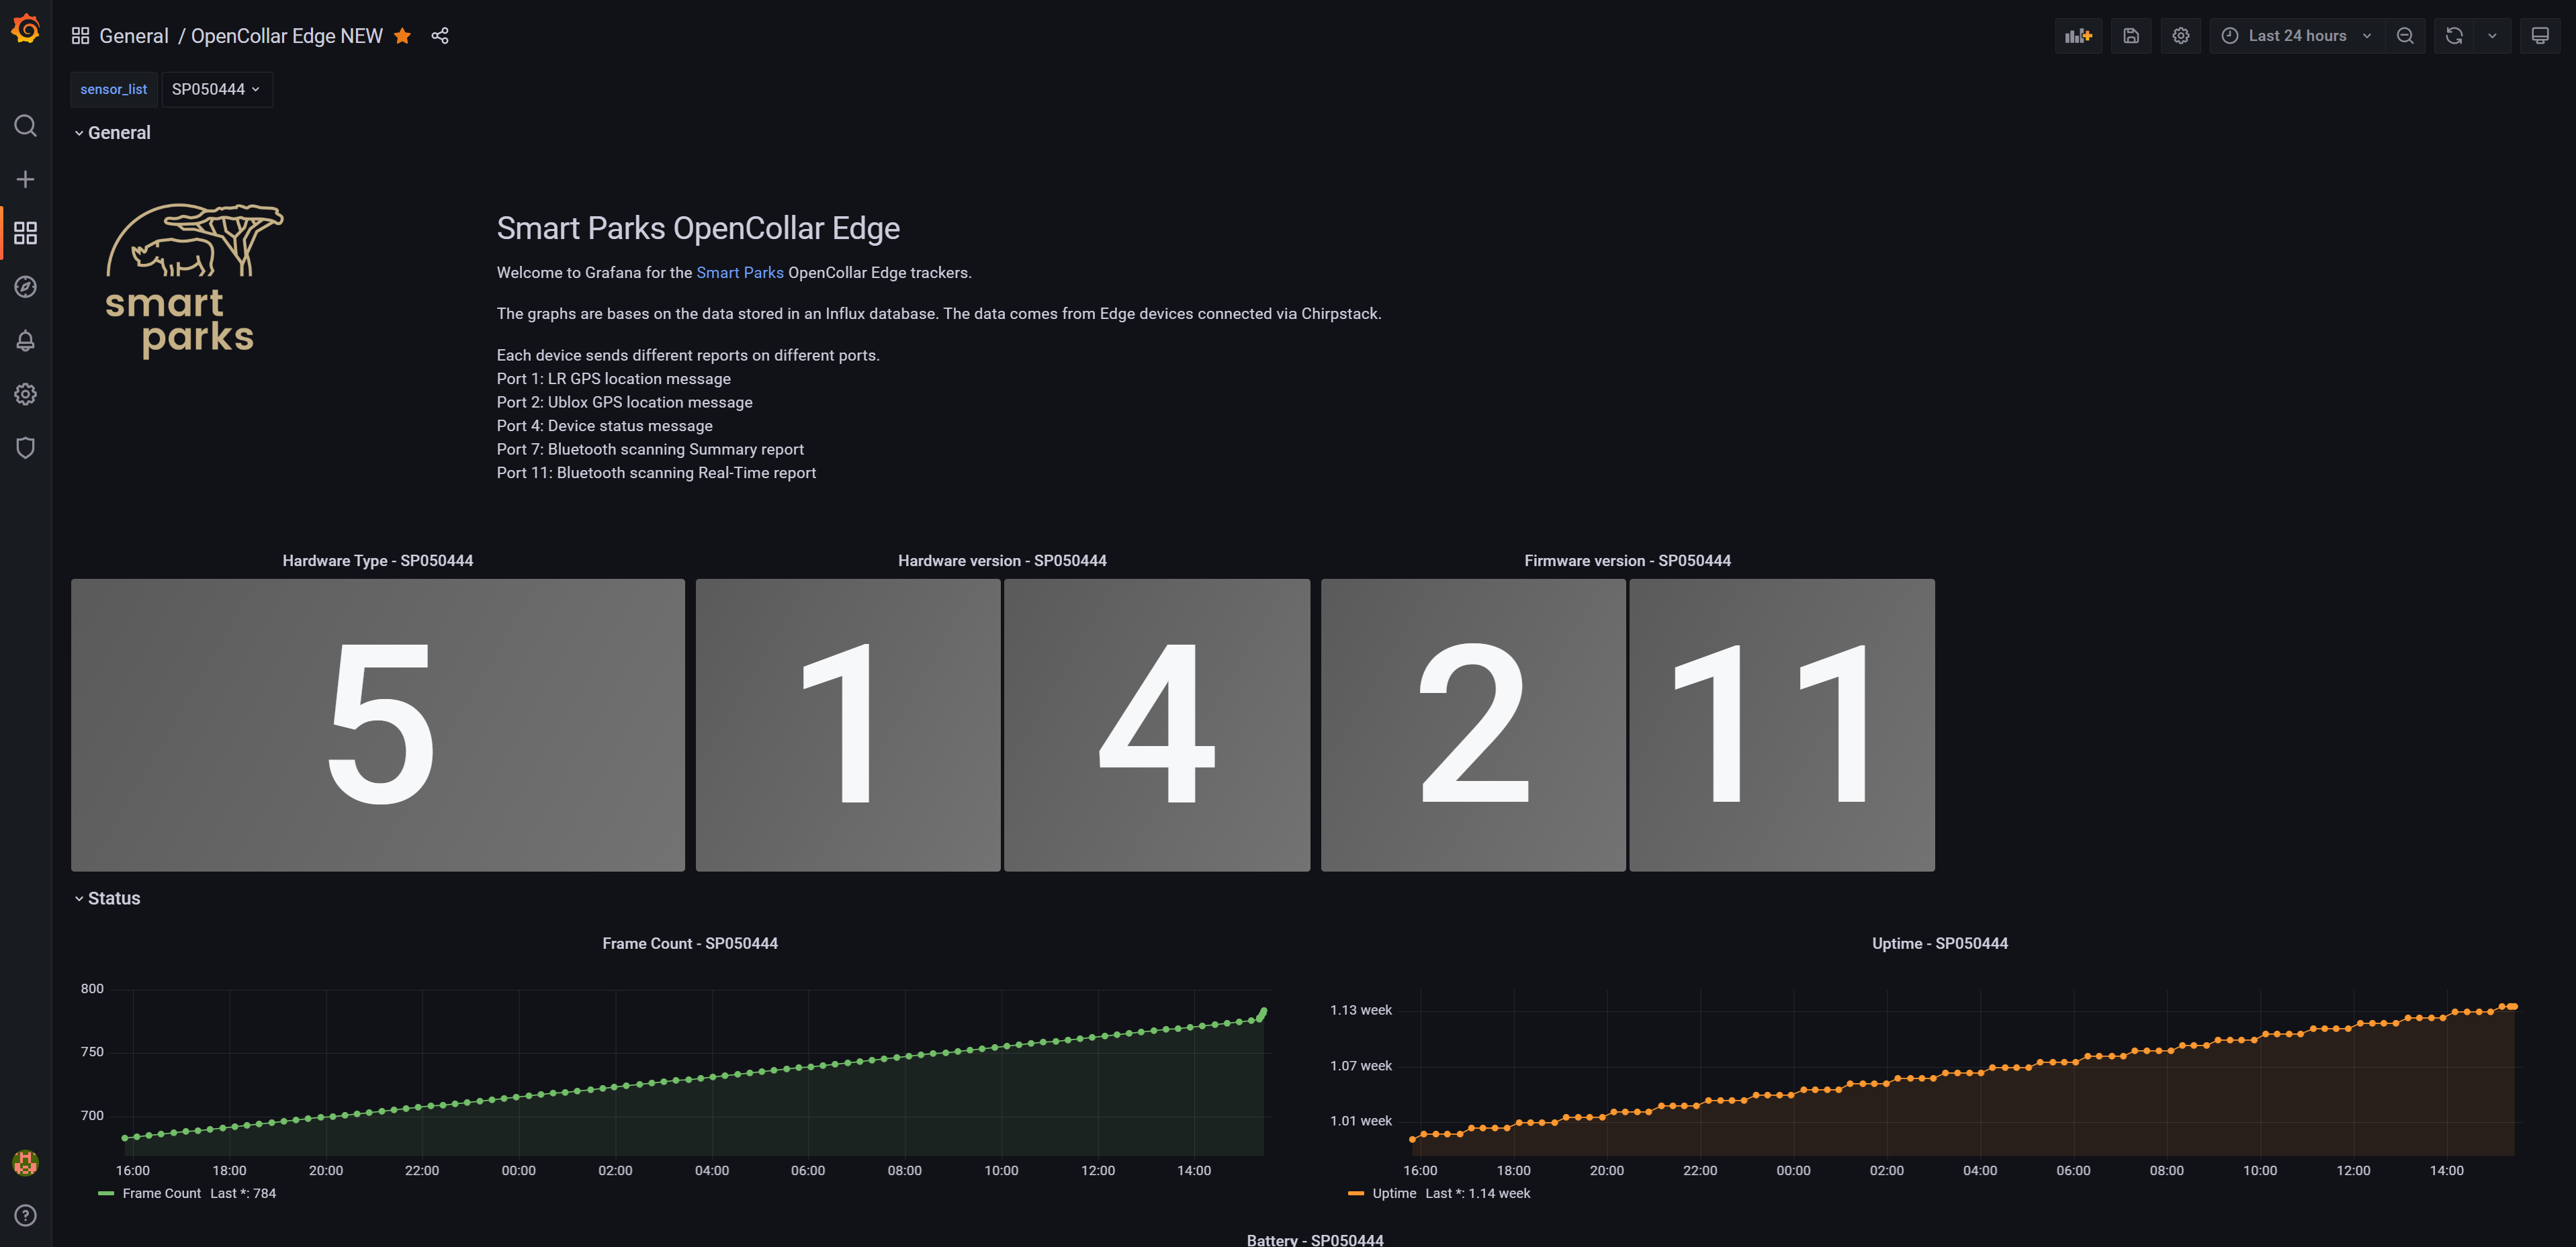
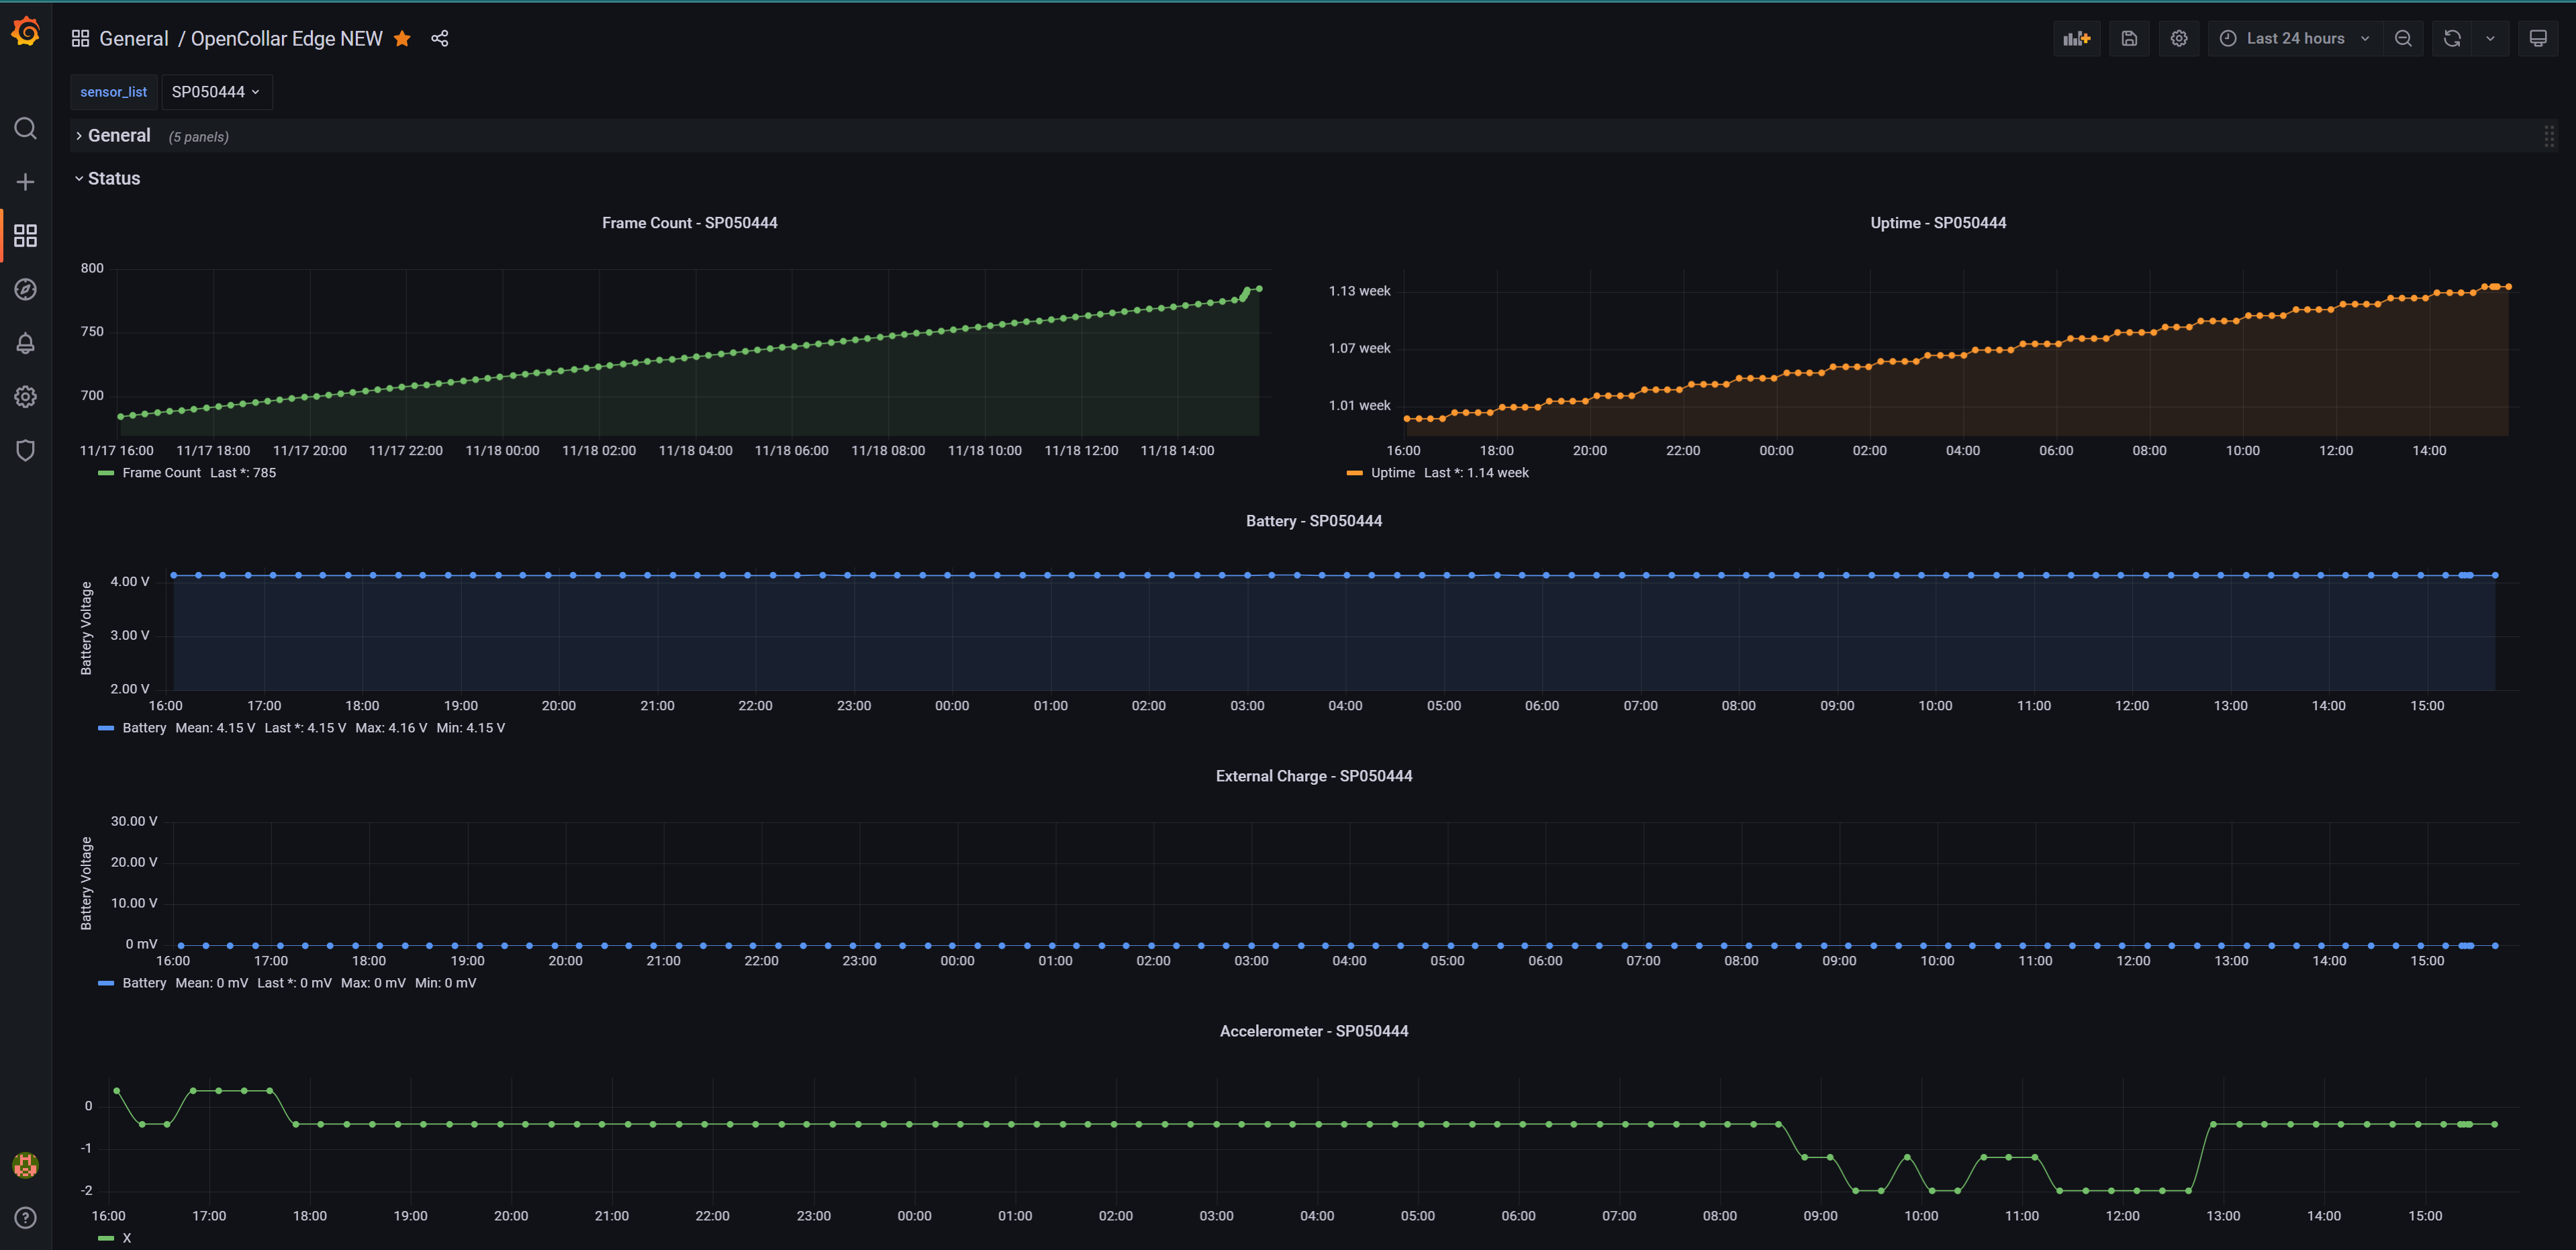
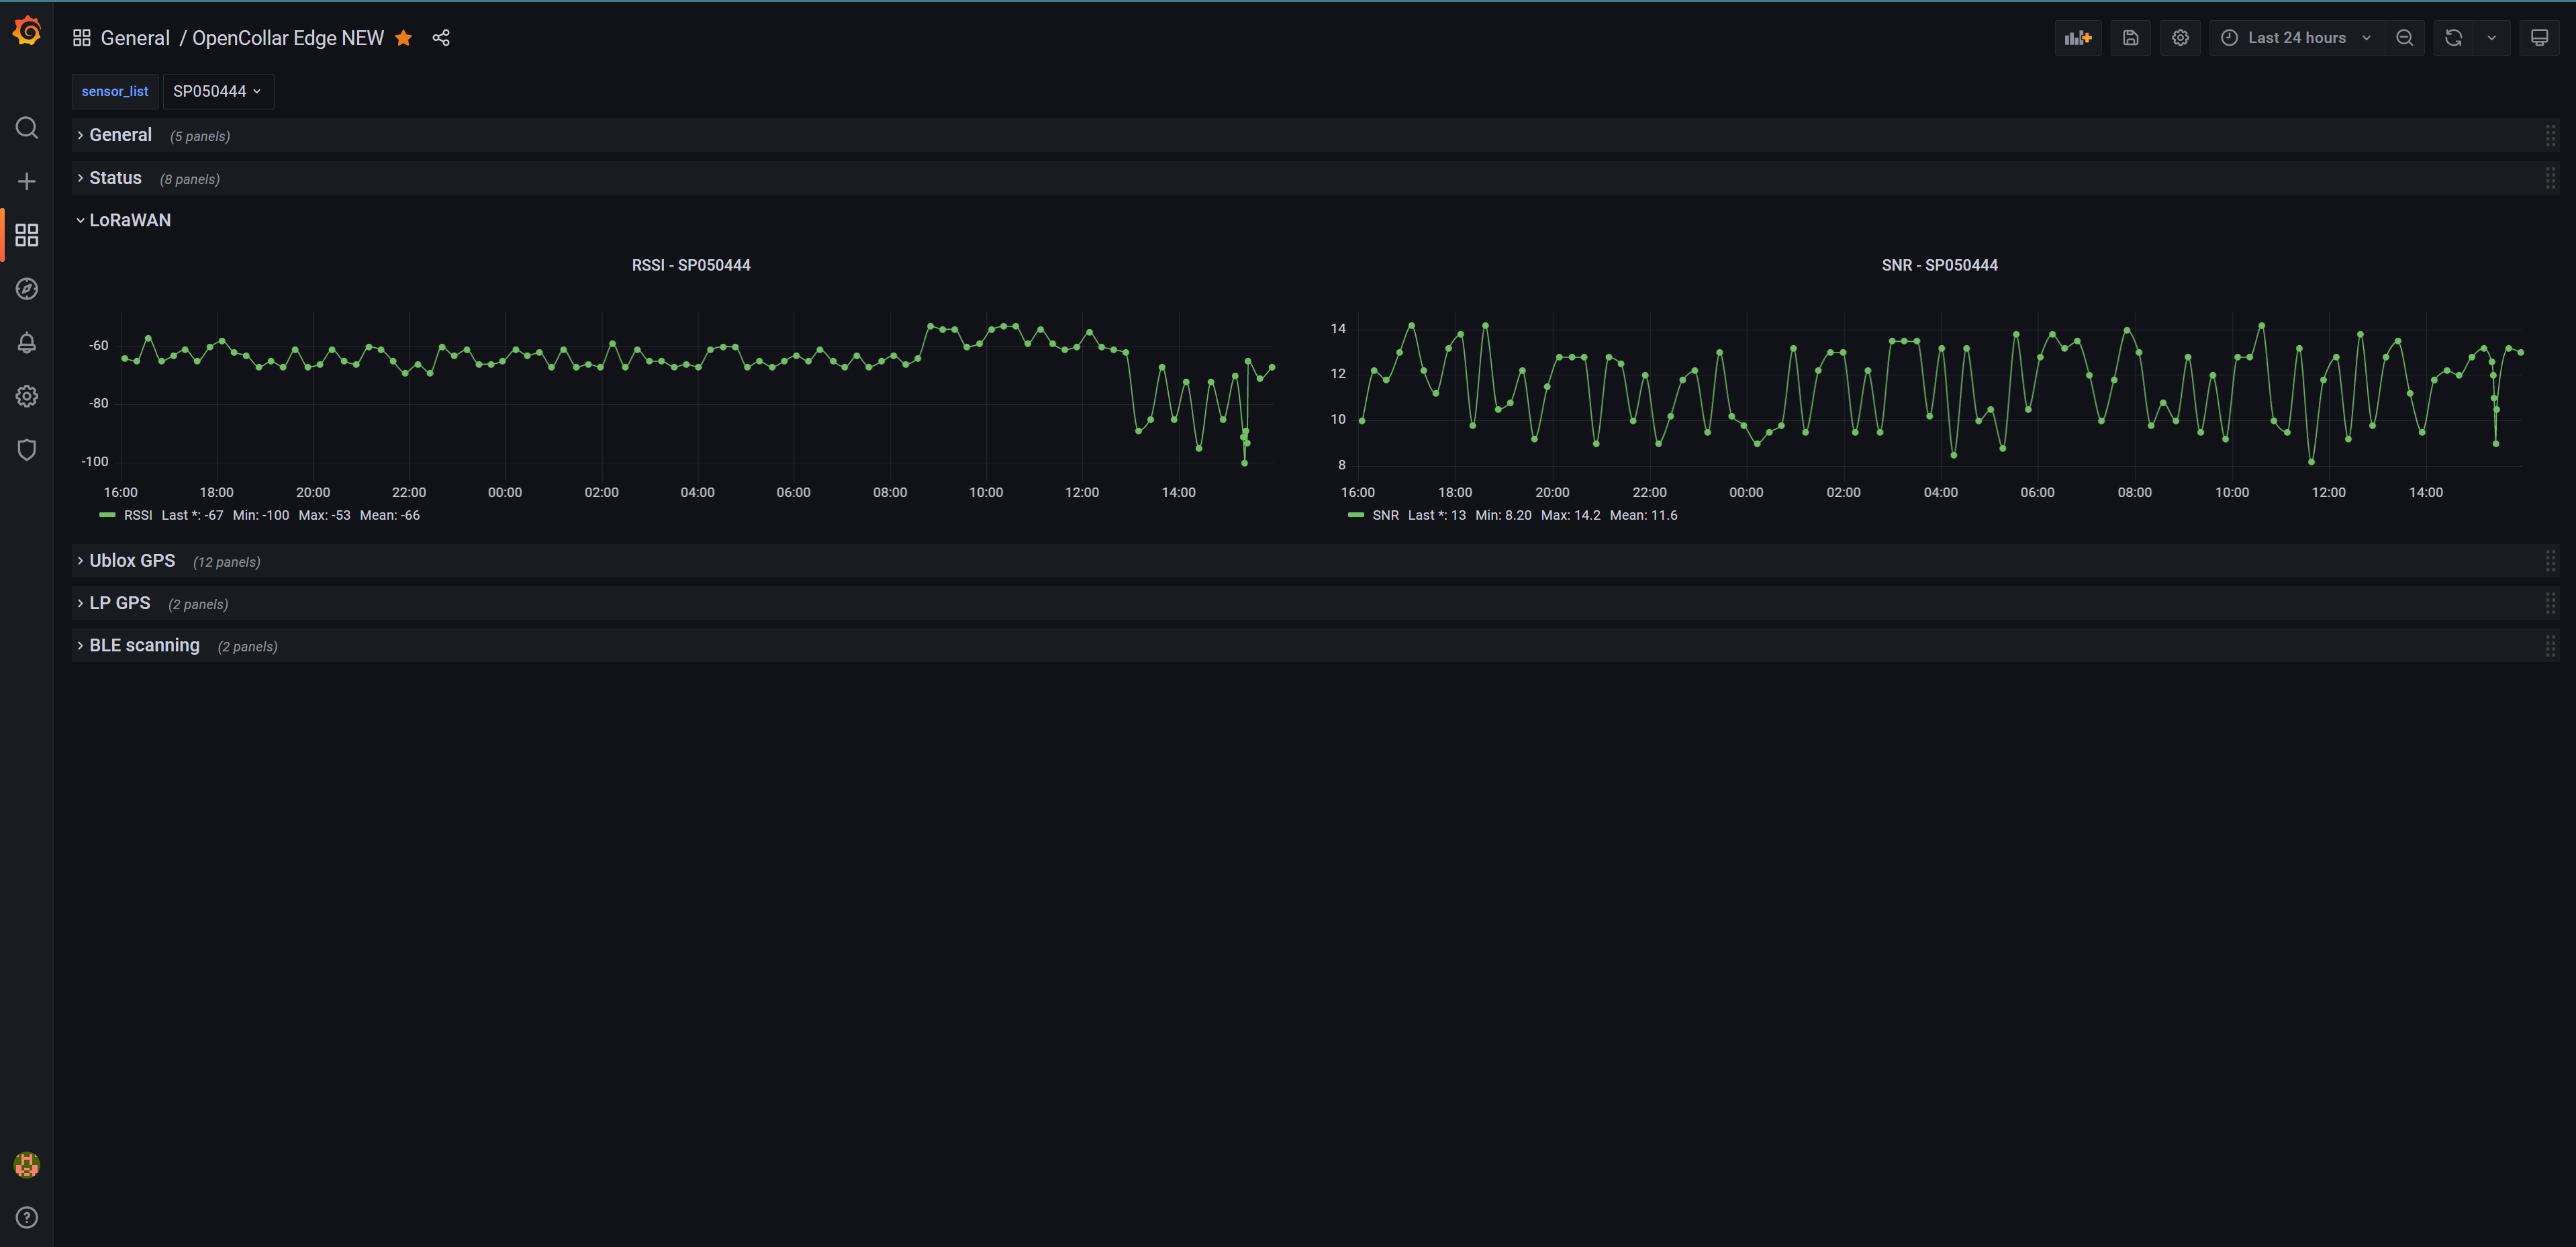
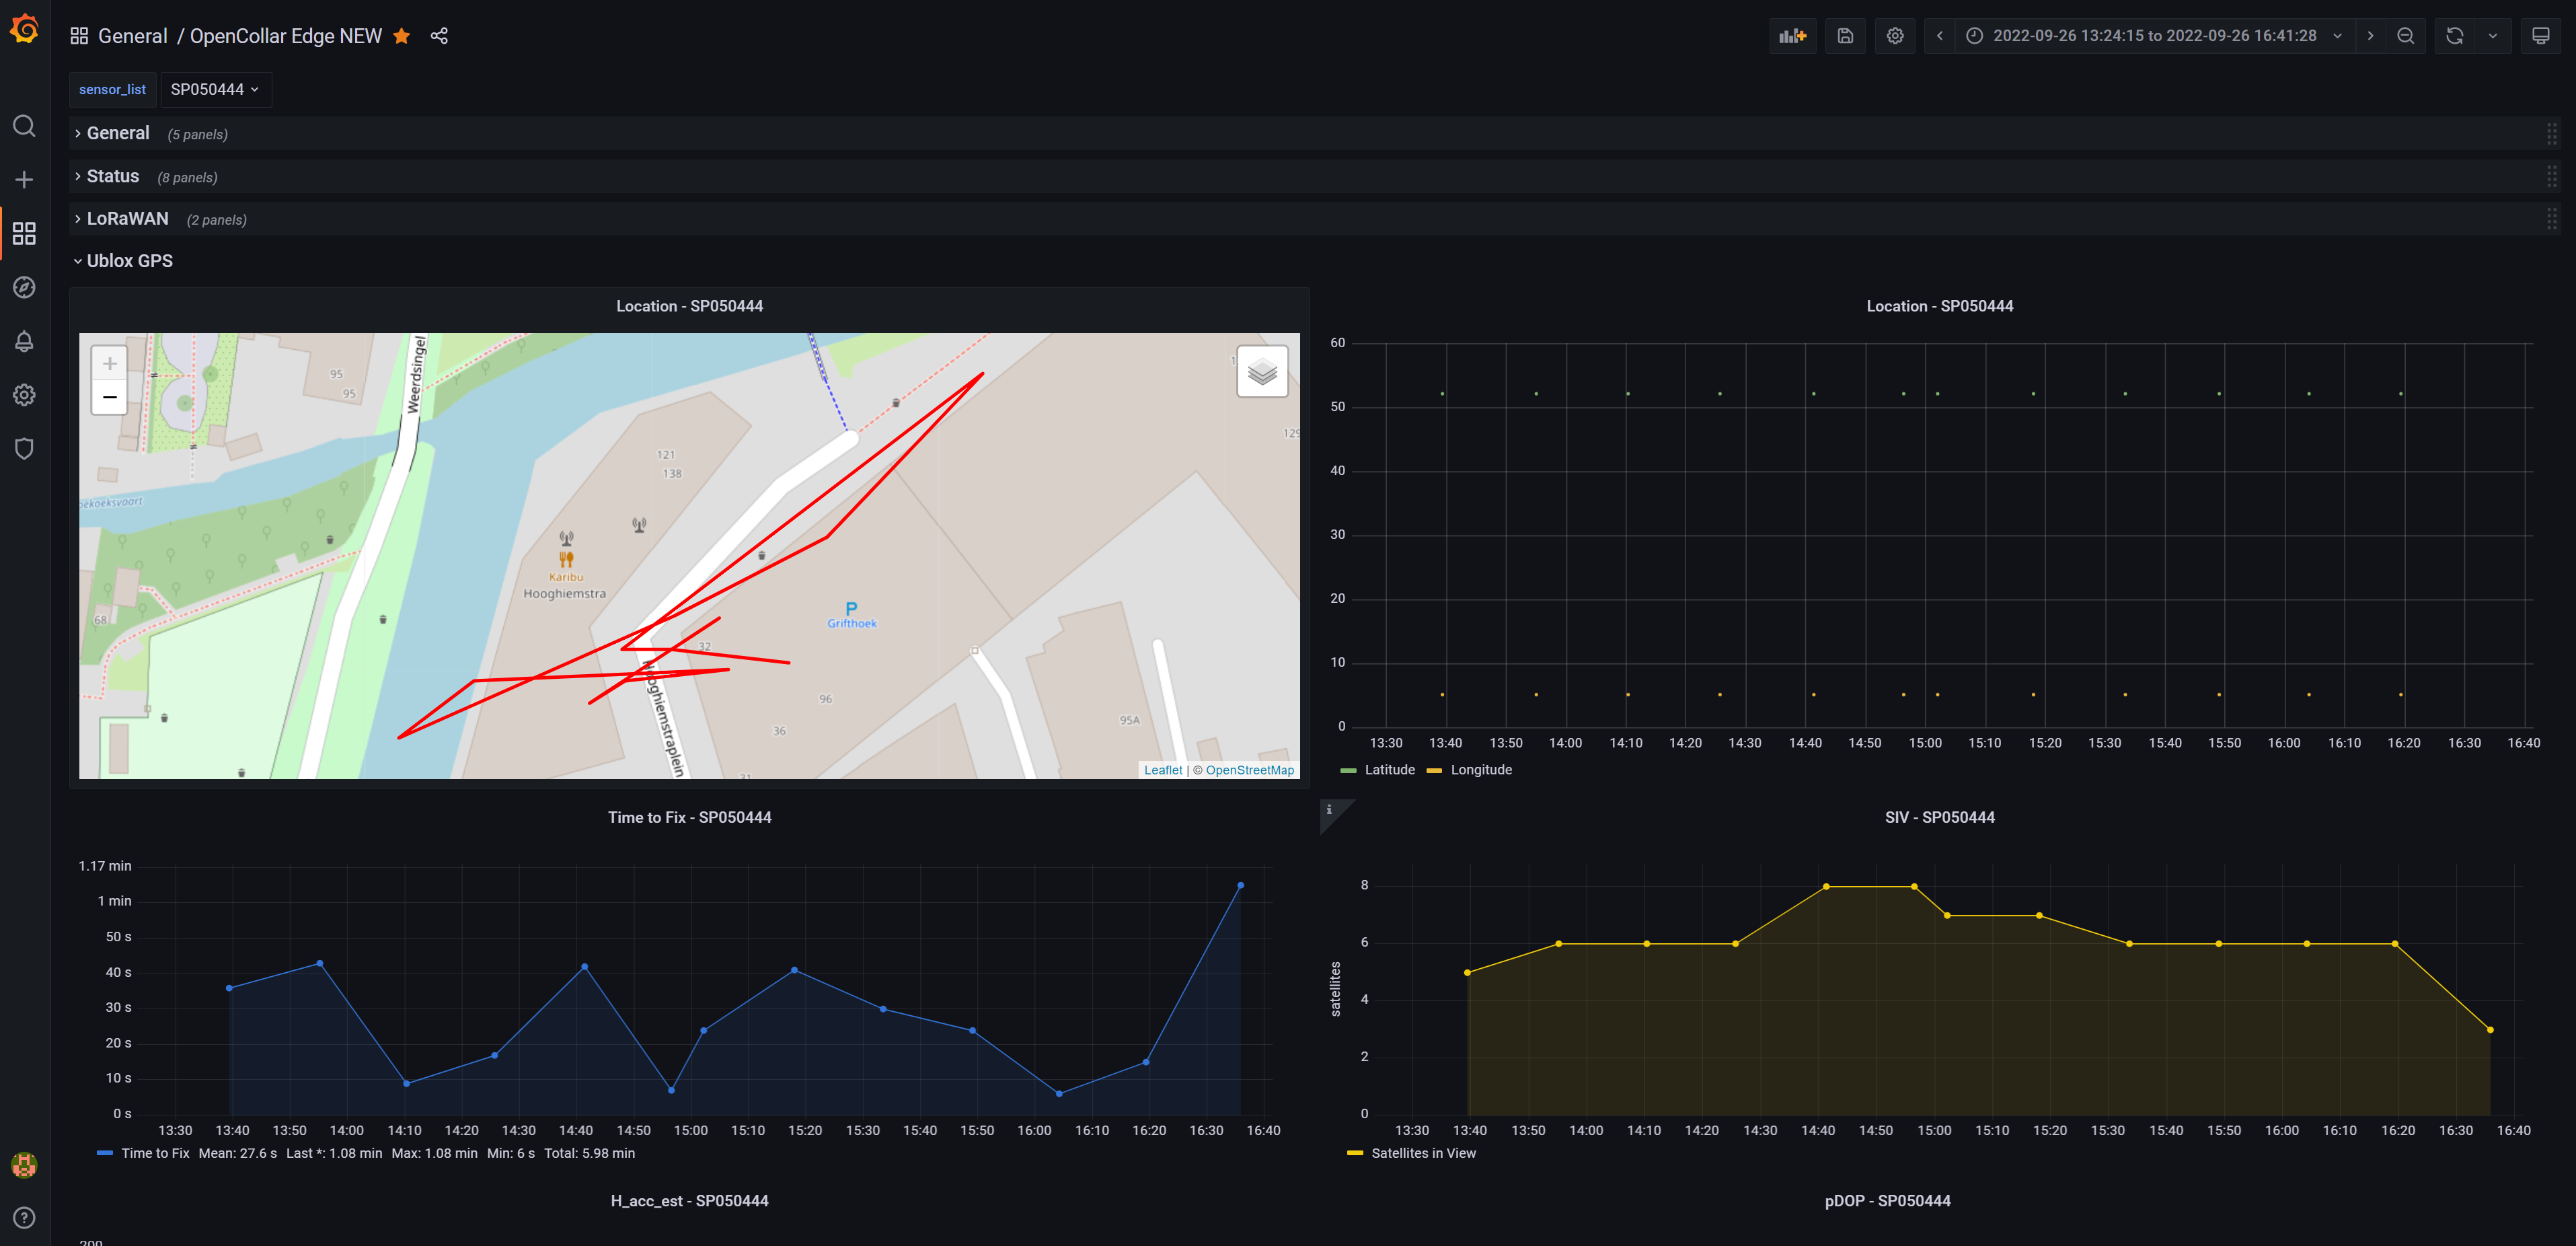
This dashboard is using the Influx data source to display most decoded data coming from the OpenCollar Edge devices. The dashboard has been dividend into different sections.
¶ Rain Gauge Details
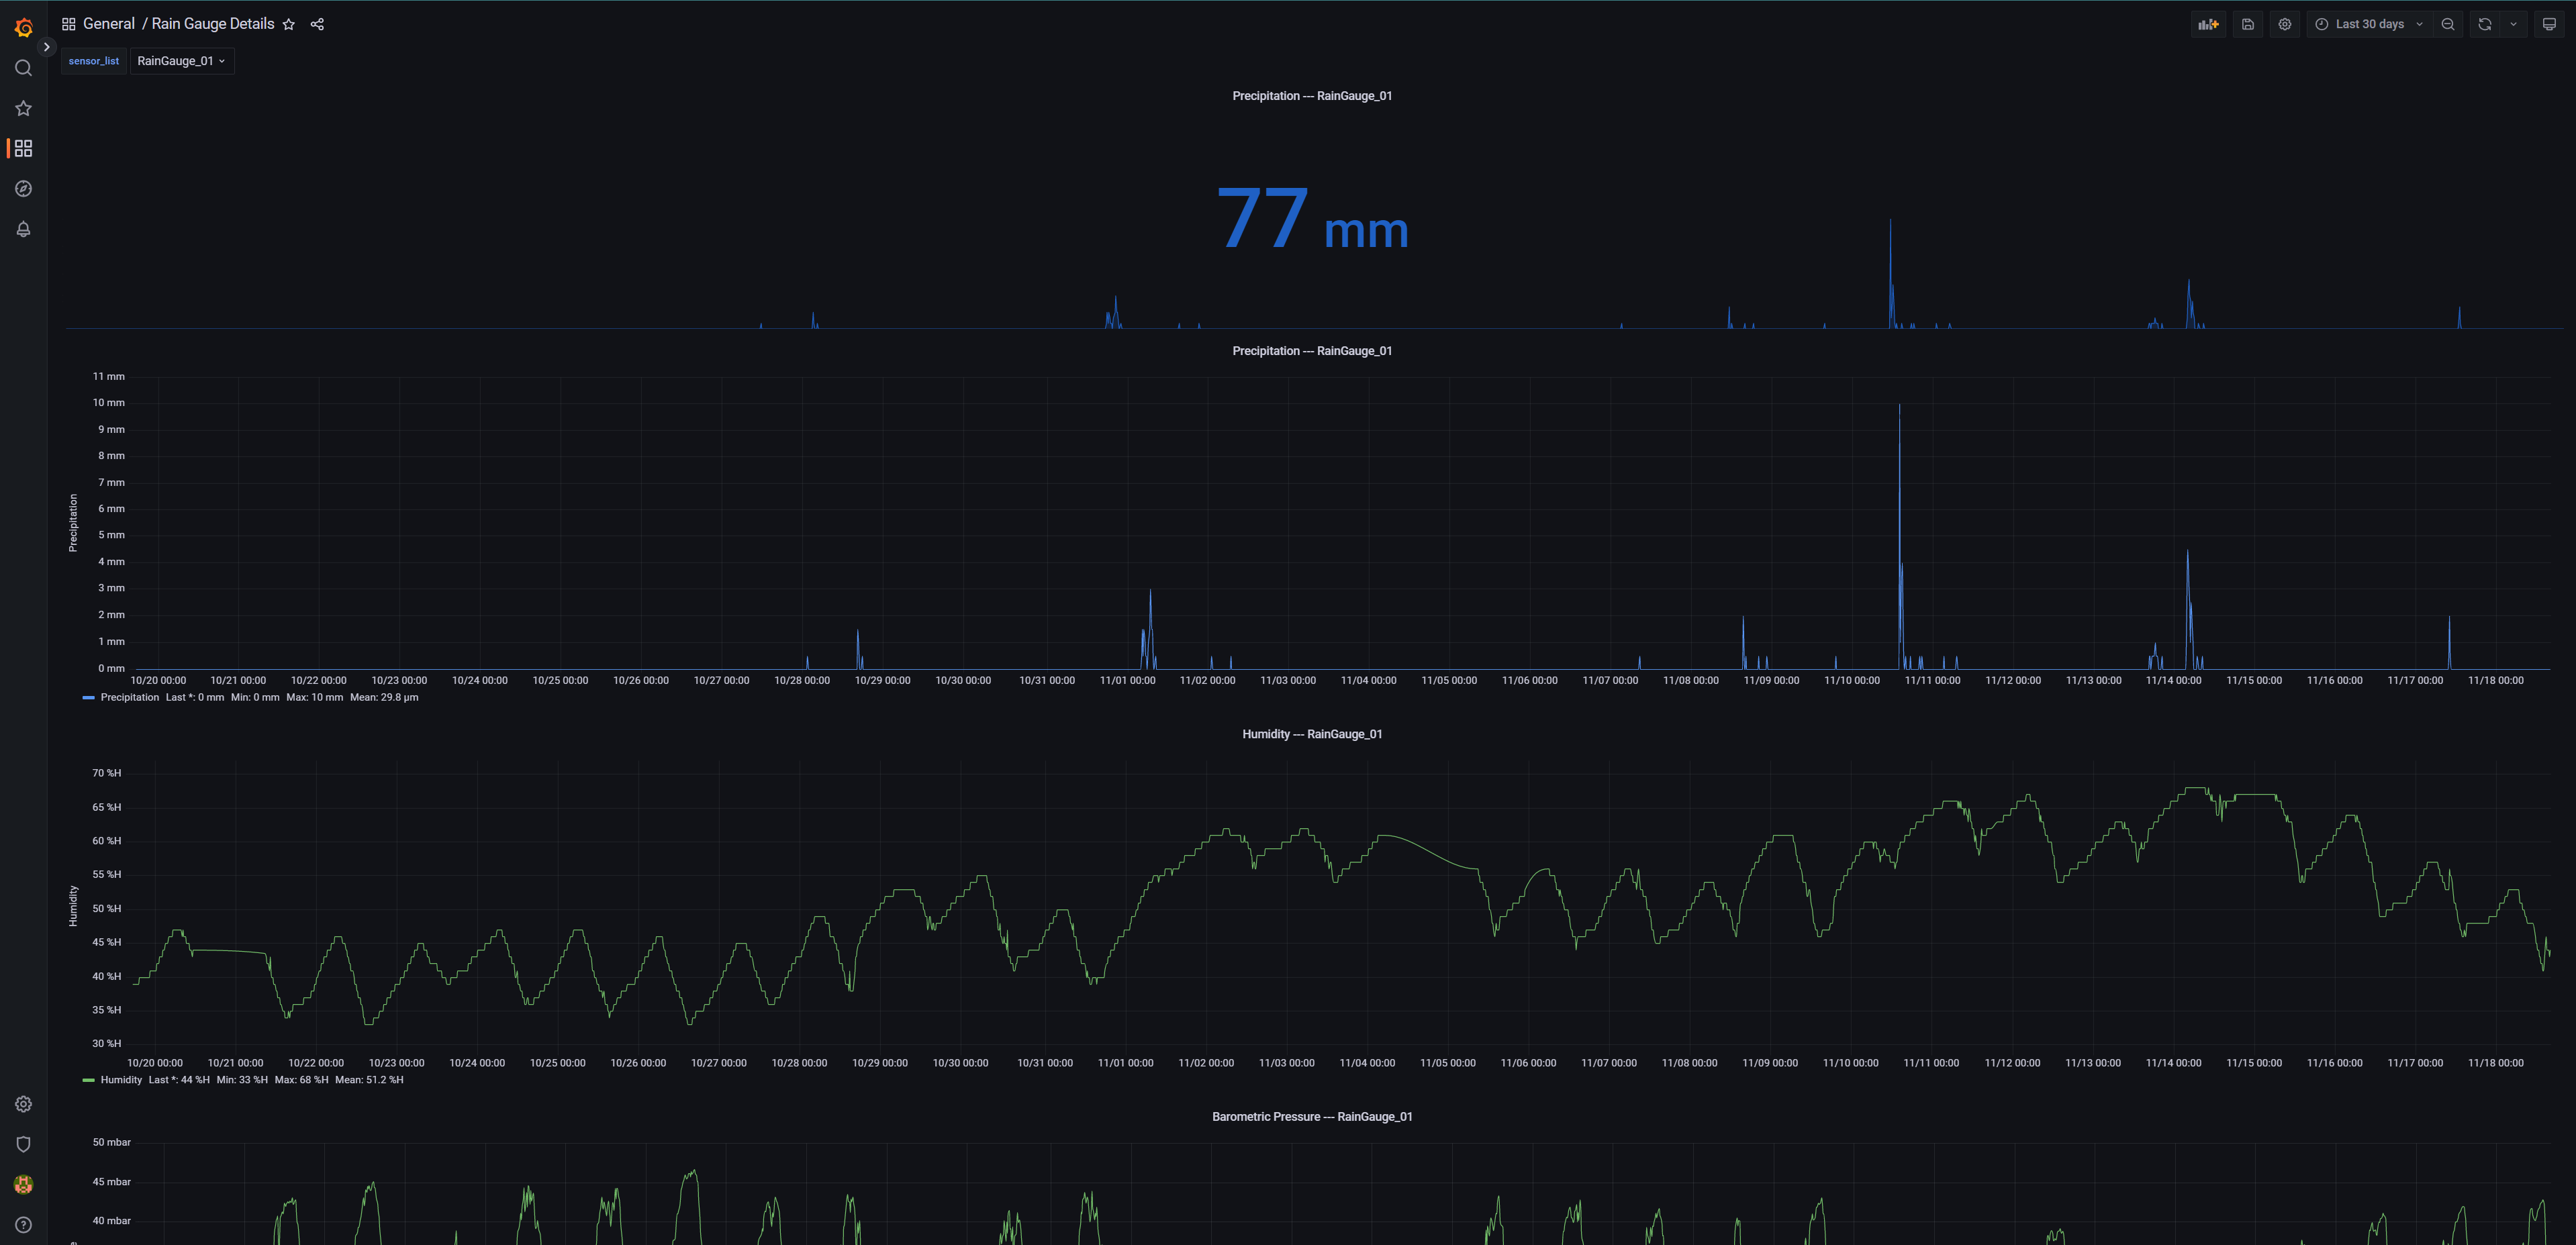
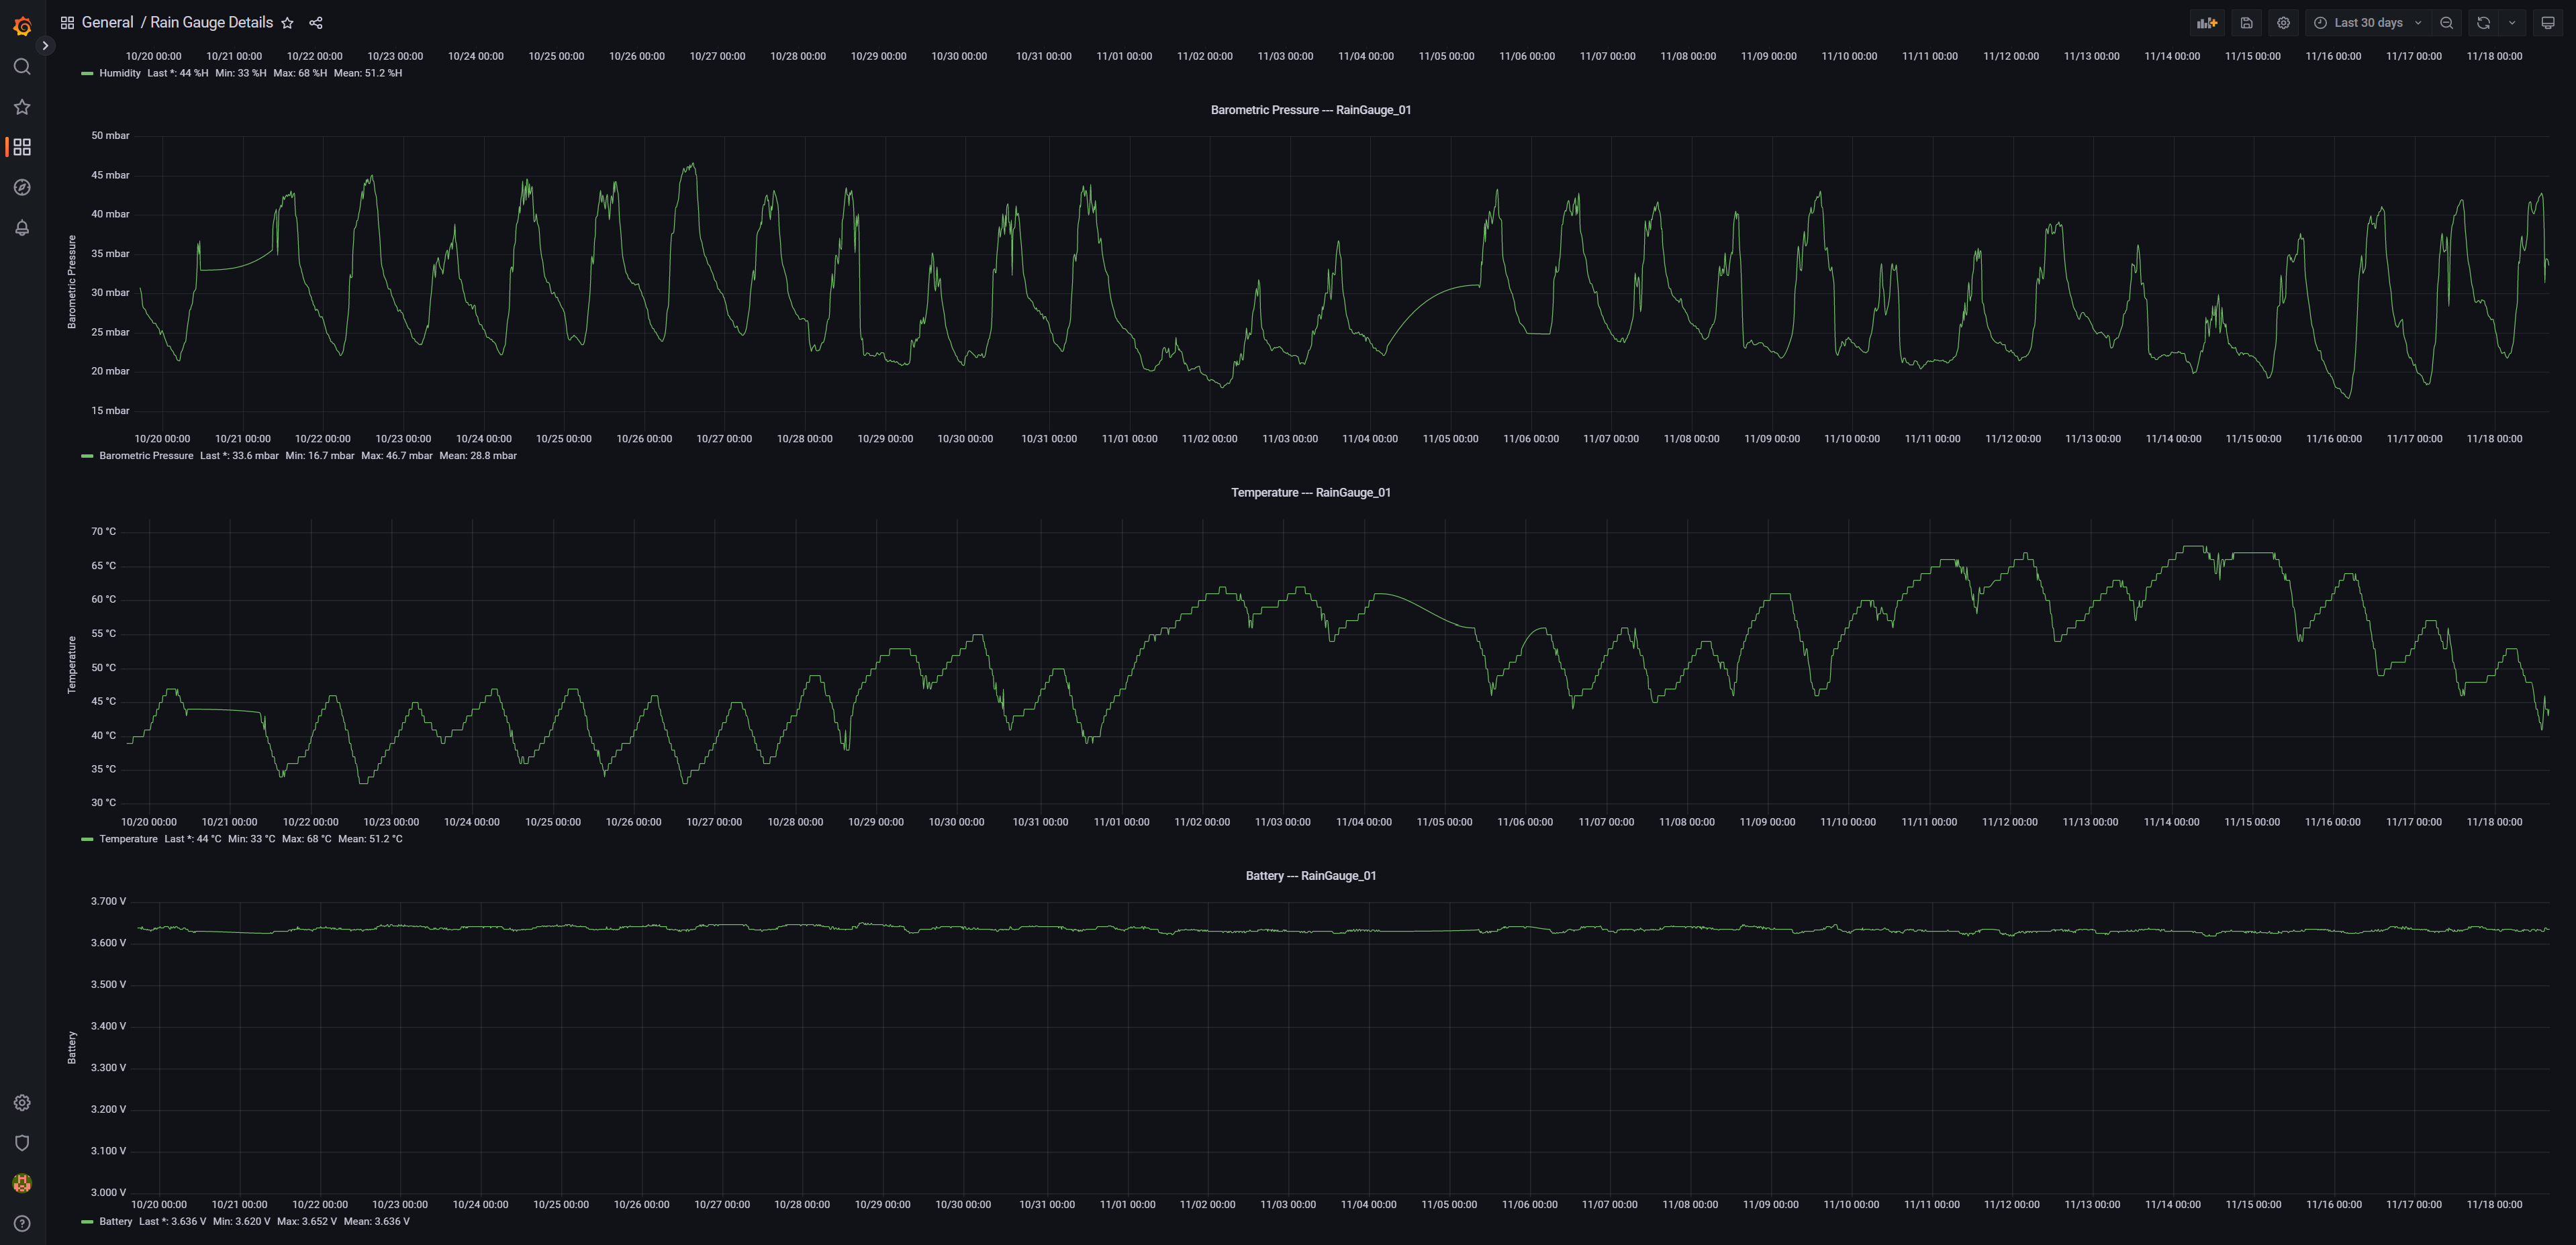
This dashboard is using the Influx data source to display most decoded data coming from the Rain Gauge devices.
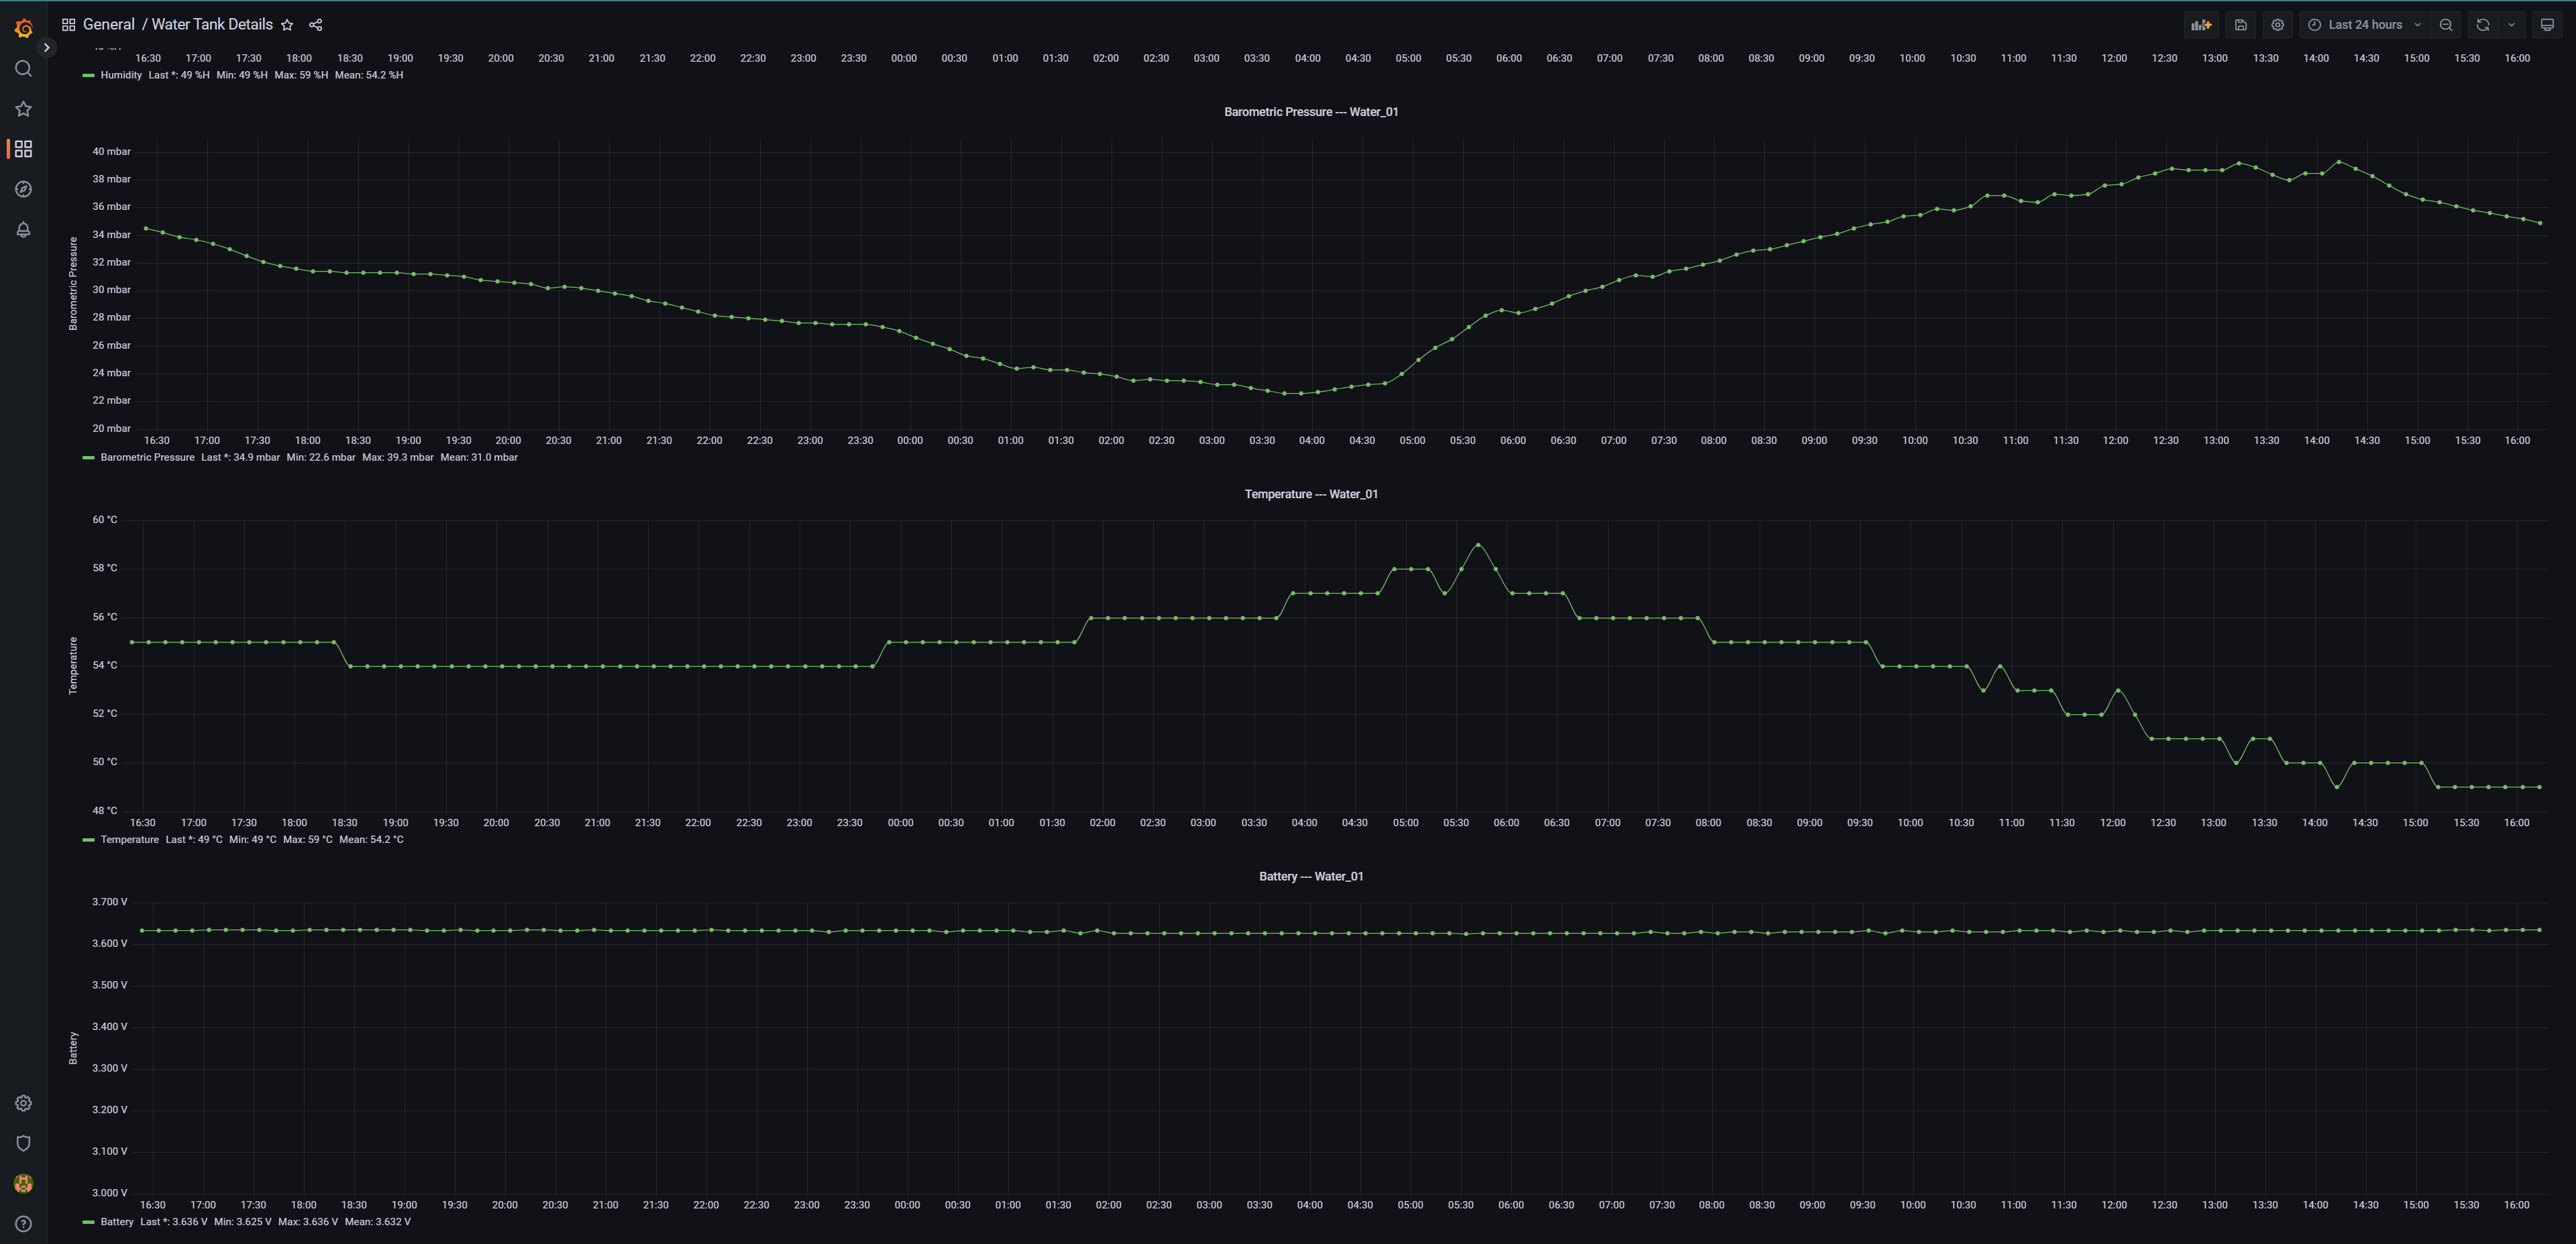
¶ Water Tank Details
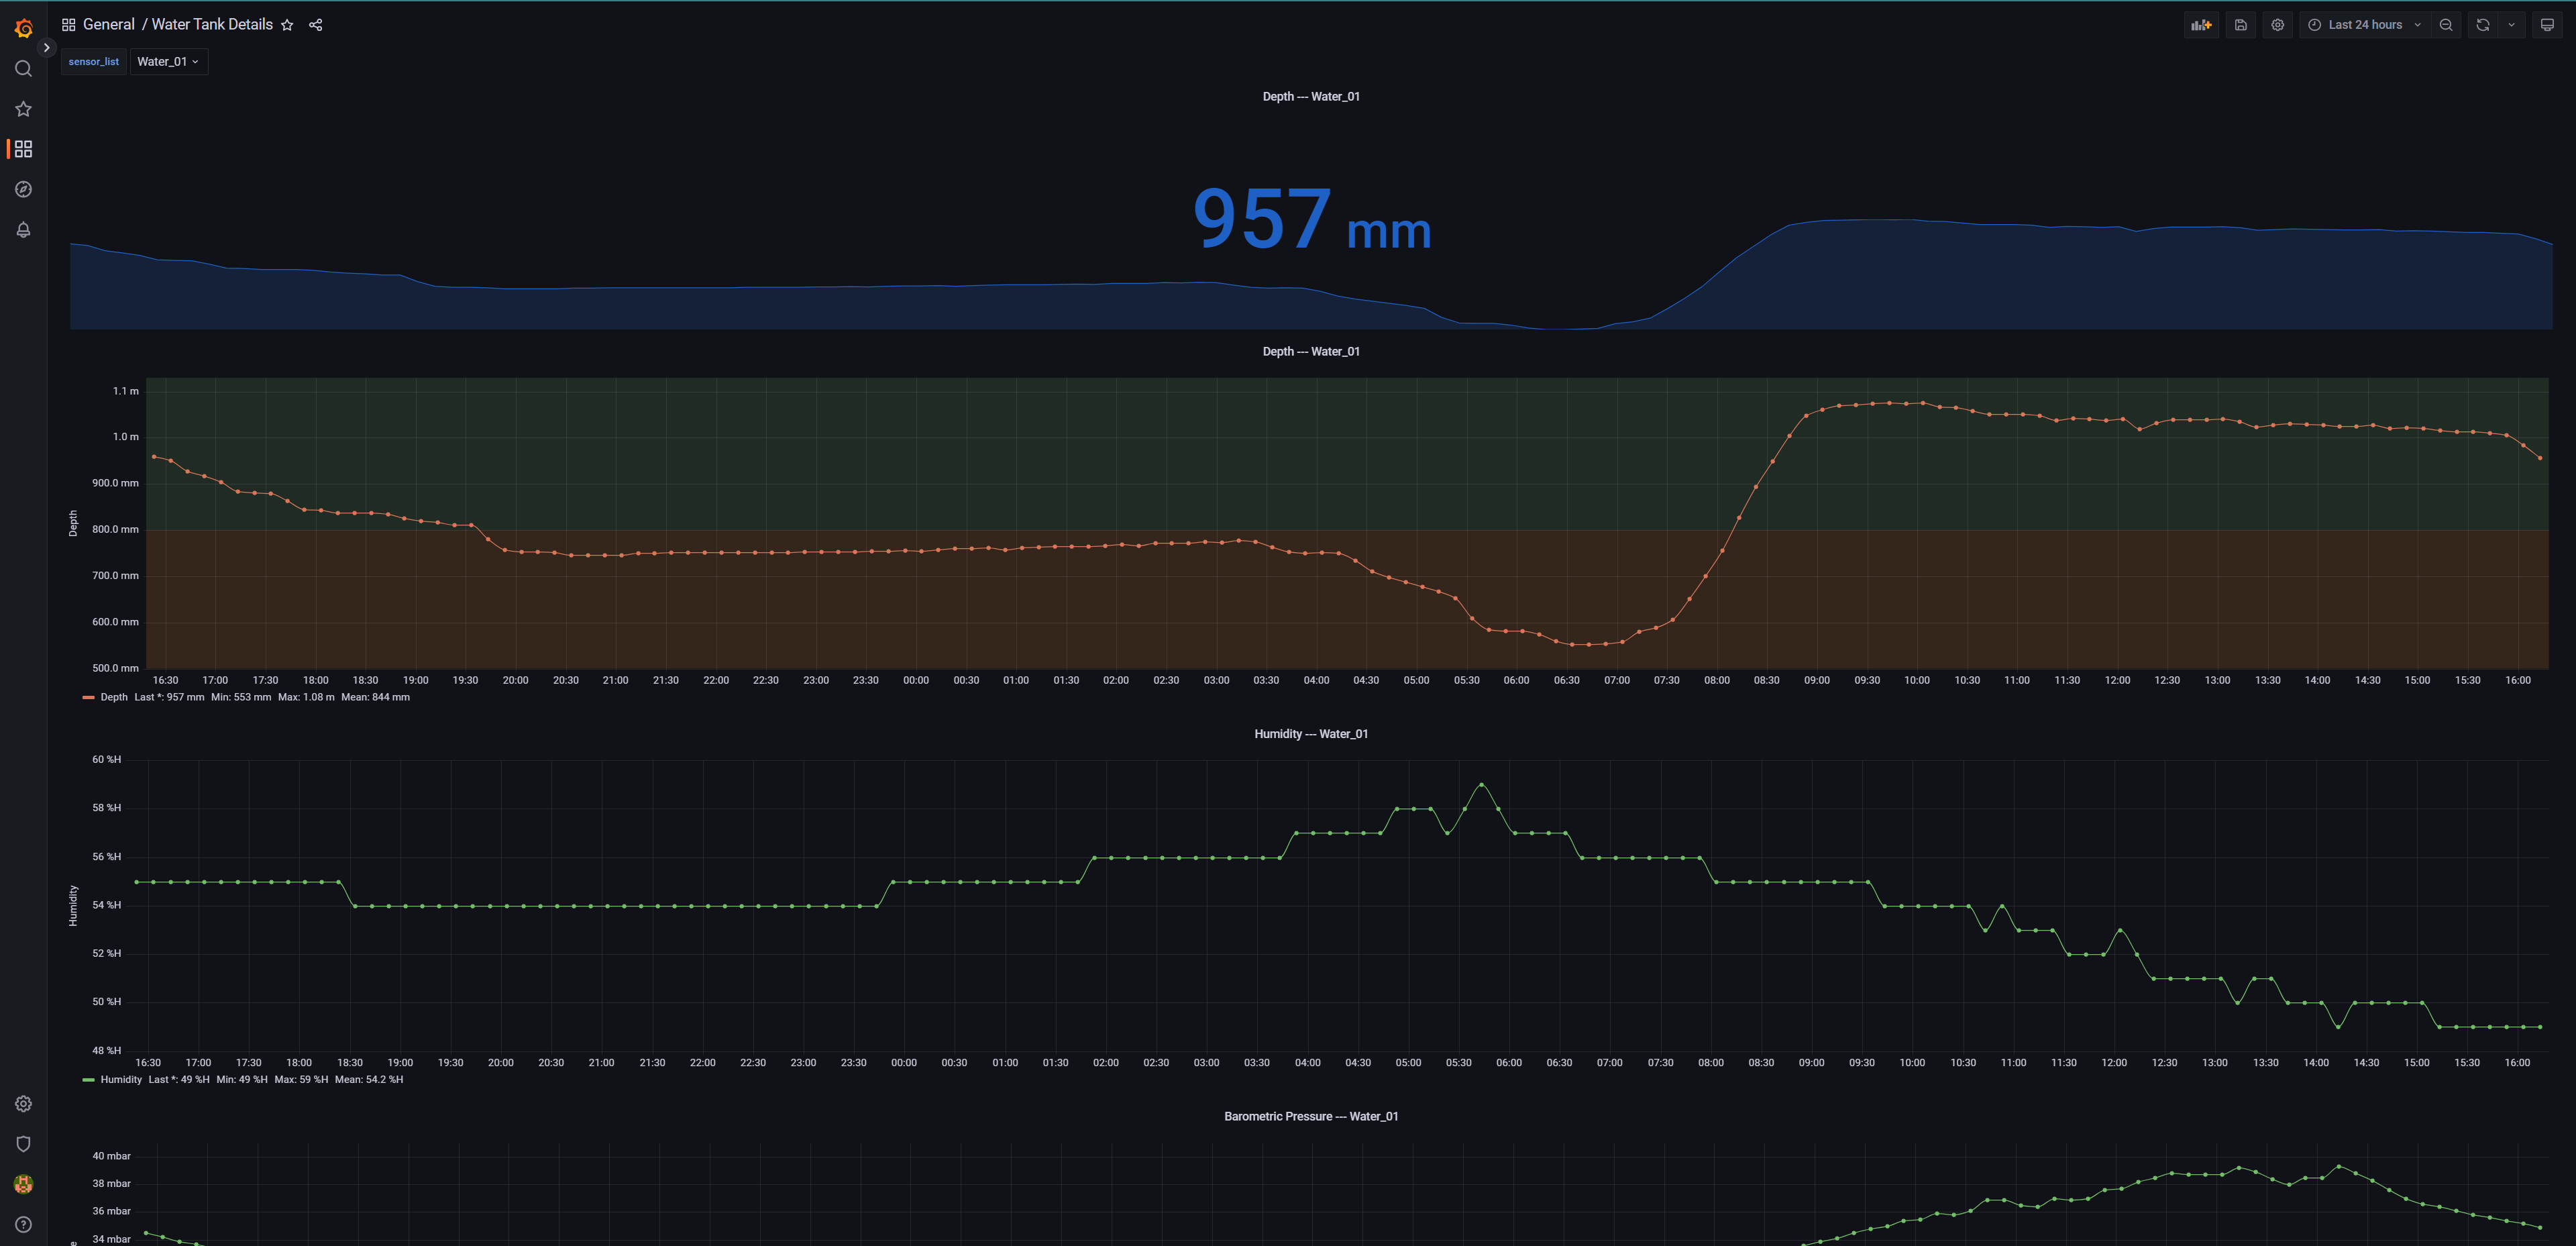
This dashboard is using the Influx data source to display most decoded data coming from the Water level devices.
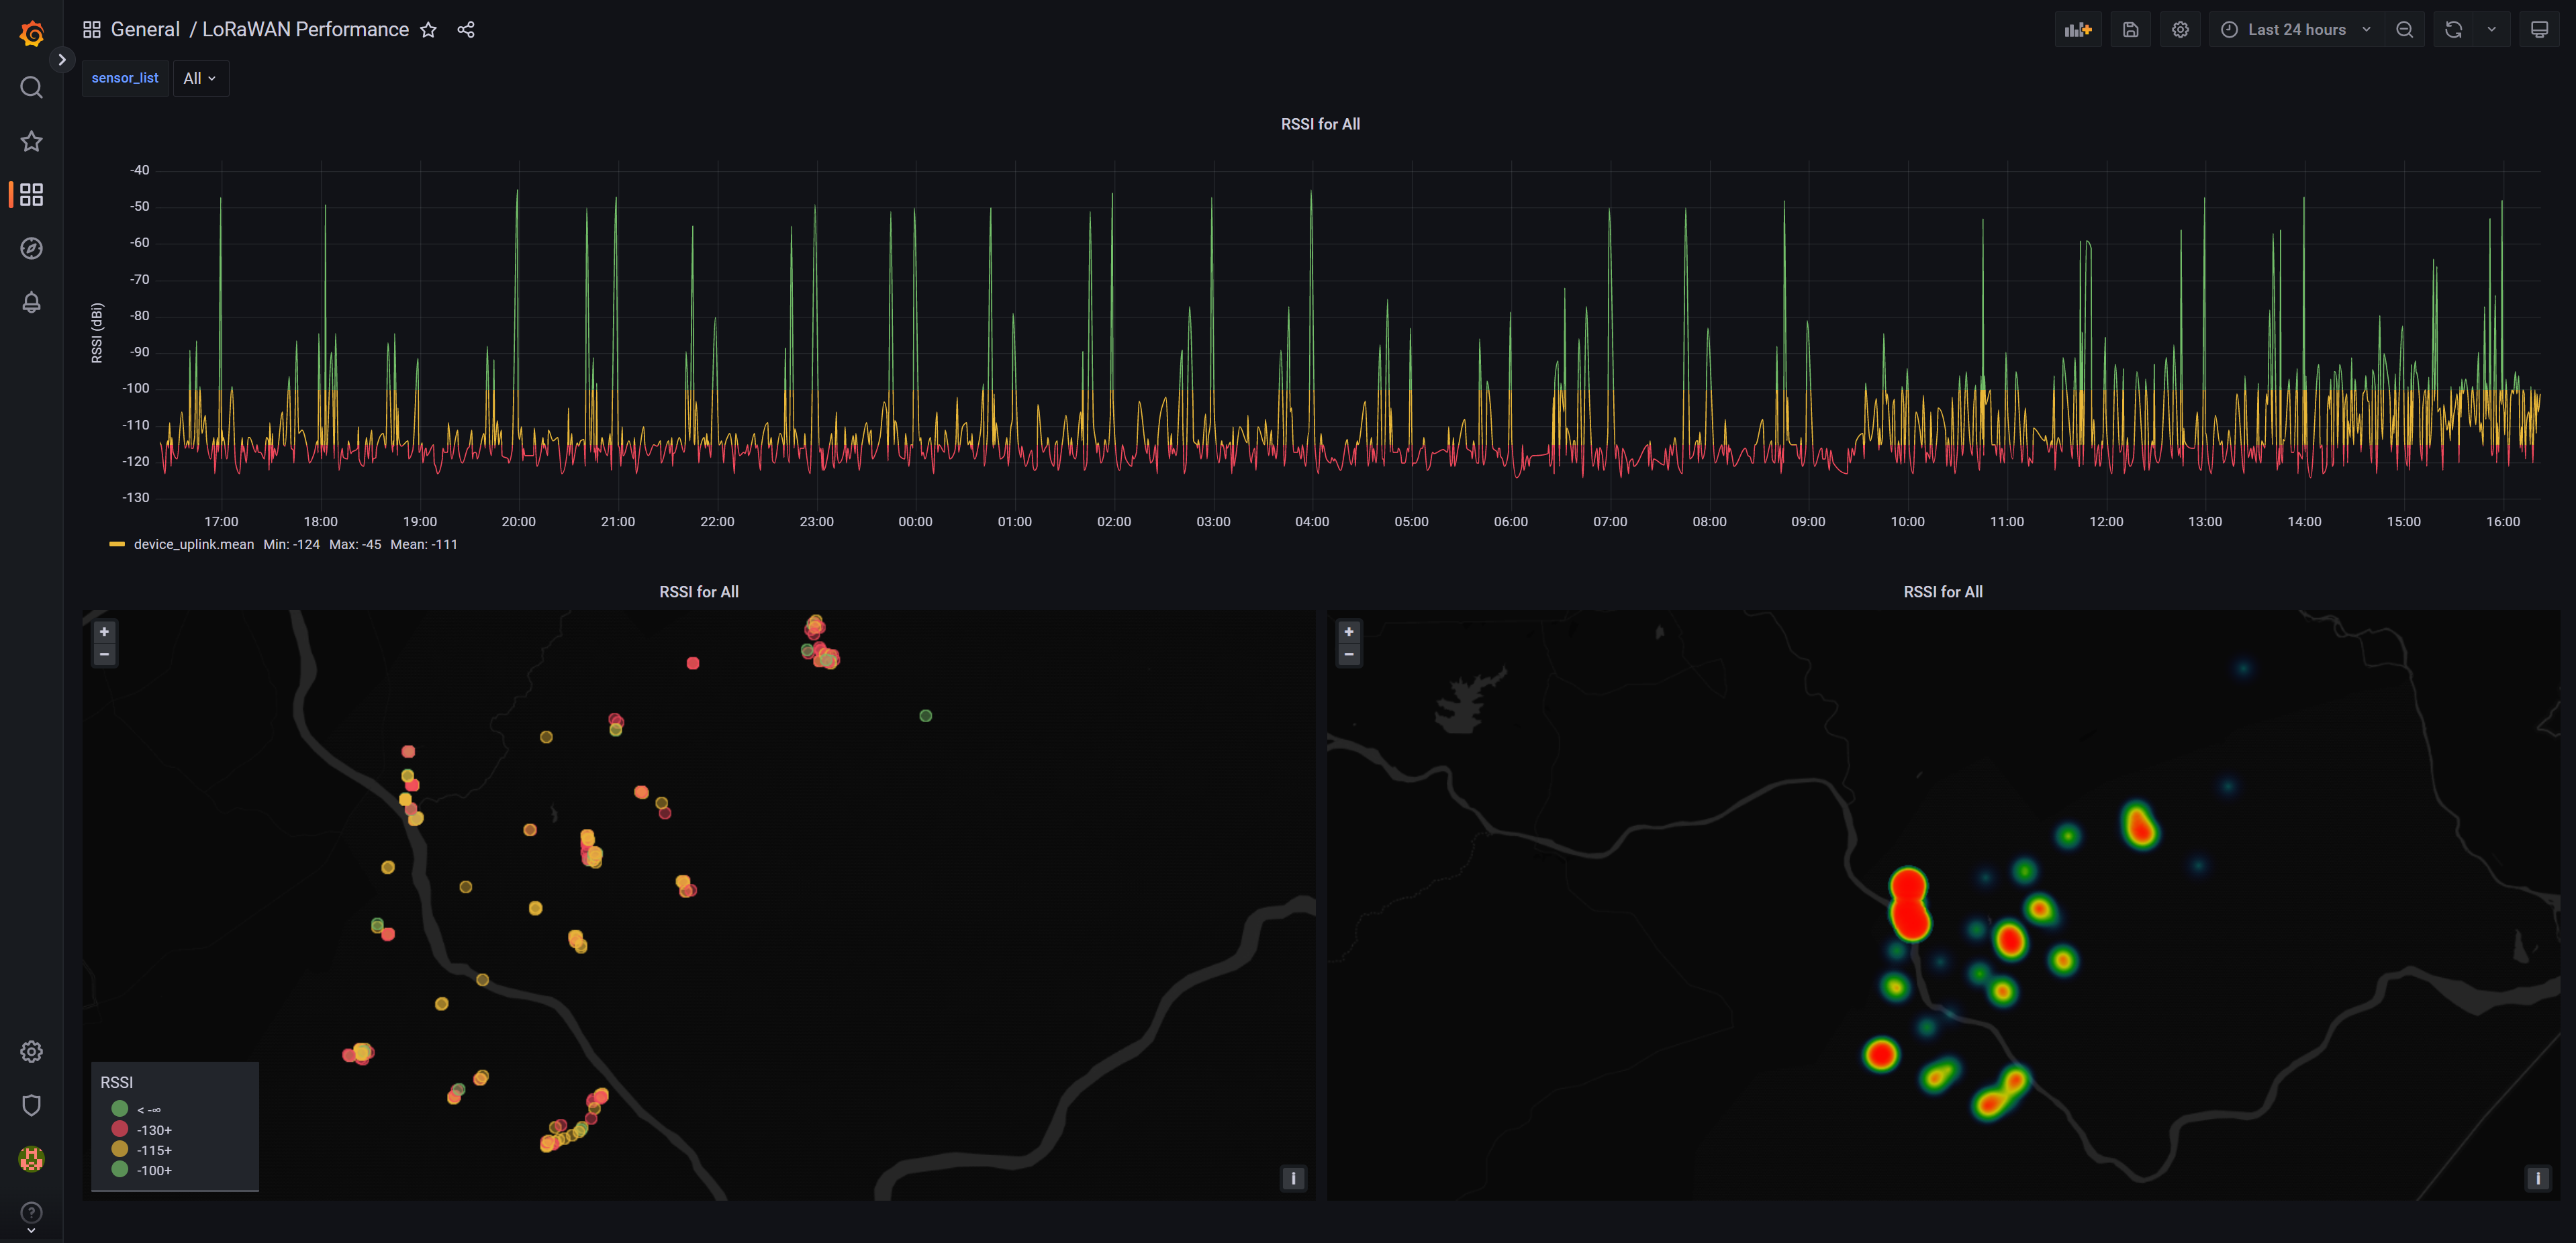
¶ LoRaWAN Performance
This dashboard is using the Influx data source to display data about the LoRaWAN performance.
¶ Grafana - admin
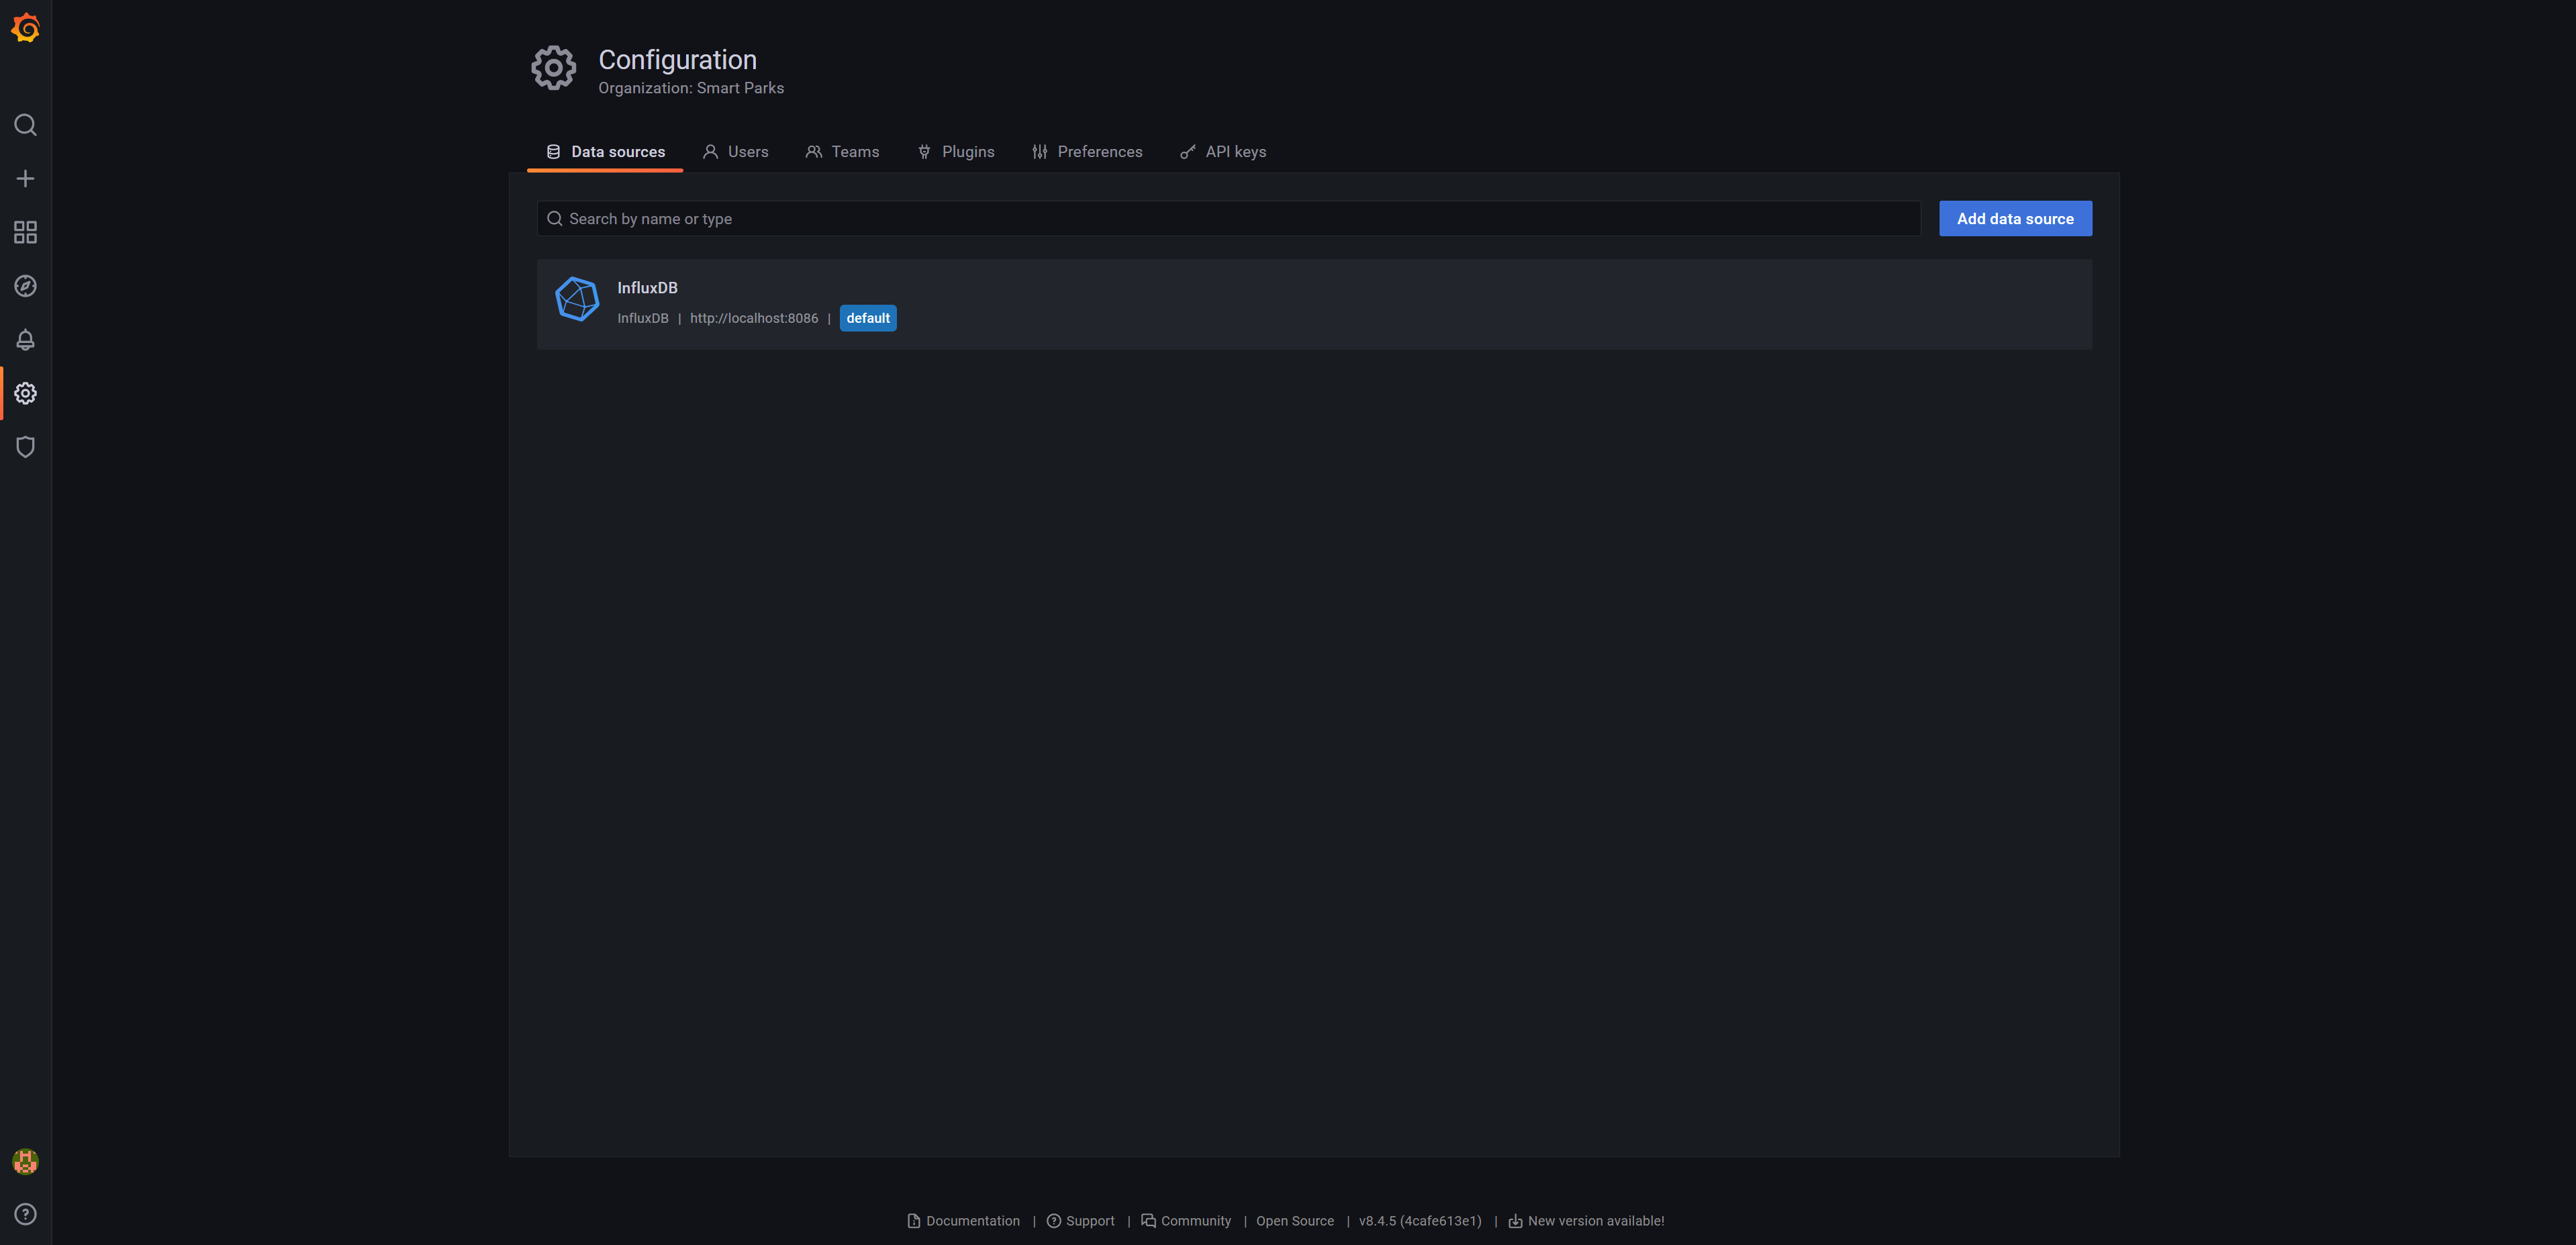
¶ Data sources
As Grafana is only a data visualisation tool, it does not manage or store any of the databases or data sources itself. To use dashboards Grafana needs to have access to a data source. Multiple and many different kinds of data sources can be added here. The Smart Parks Stack often uses the InfluxDB data source that is automatically filled with all incoming messages into ChirpStack. Many other sep-up are possible.
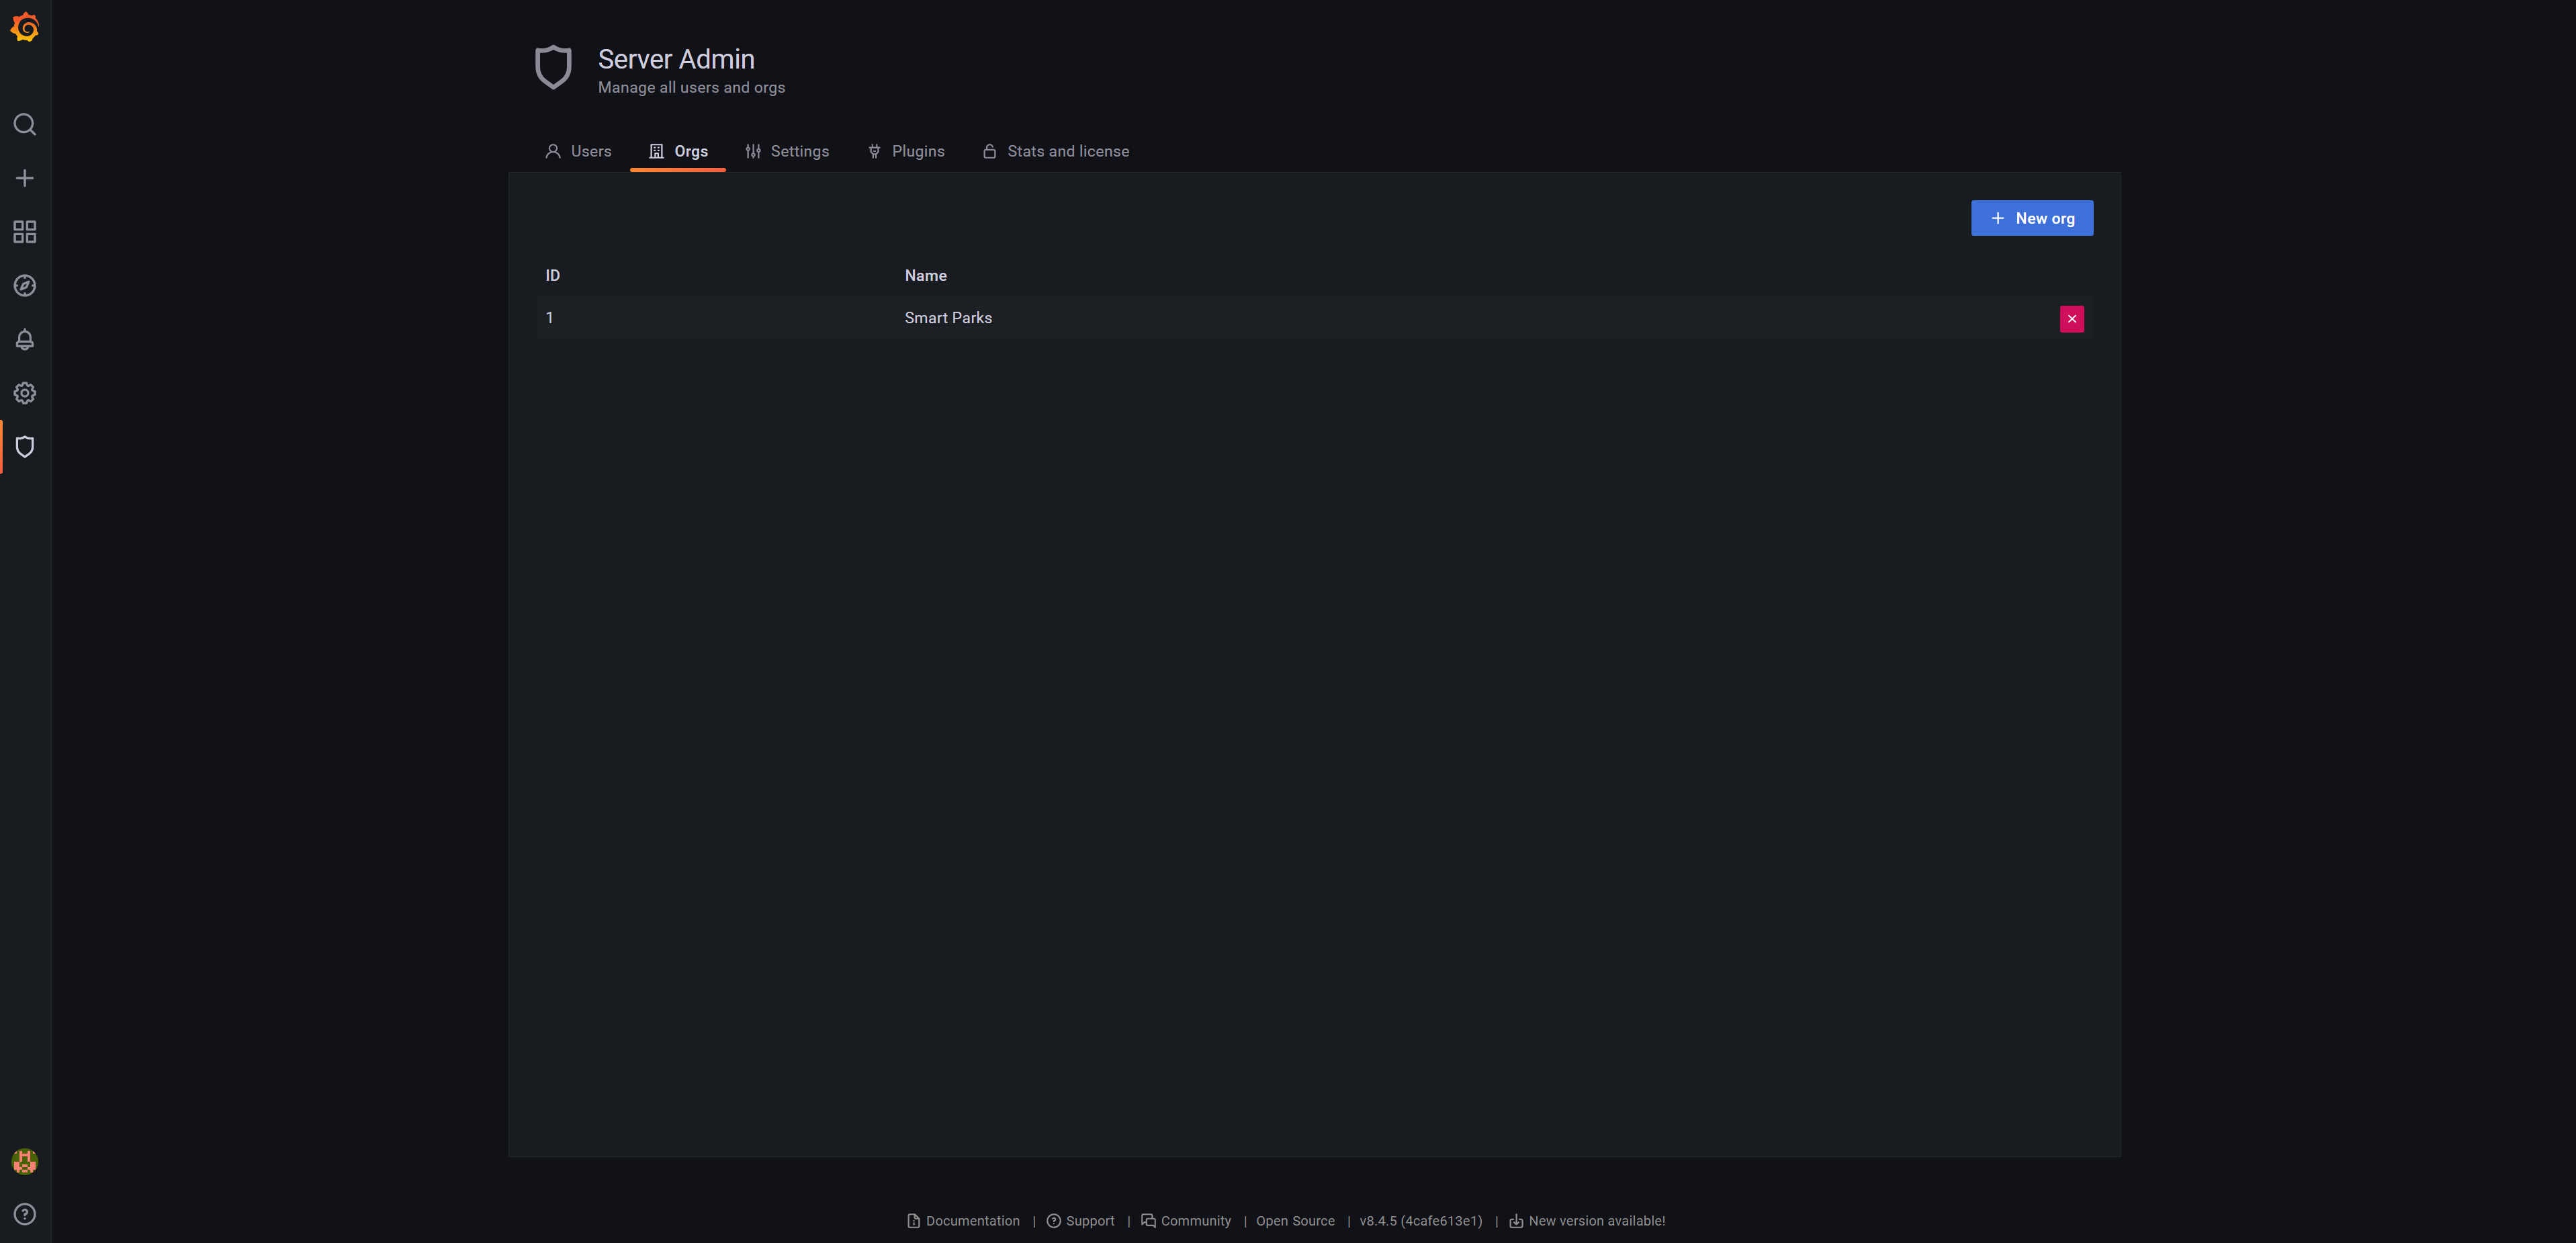
¶ Organisations
If different organisations make use of one single Grafana server, different organisations can be configured. This allows each organisations to have access to its own data sources and dashboards.
¶ Users
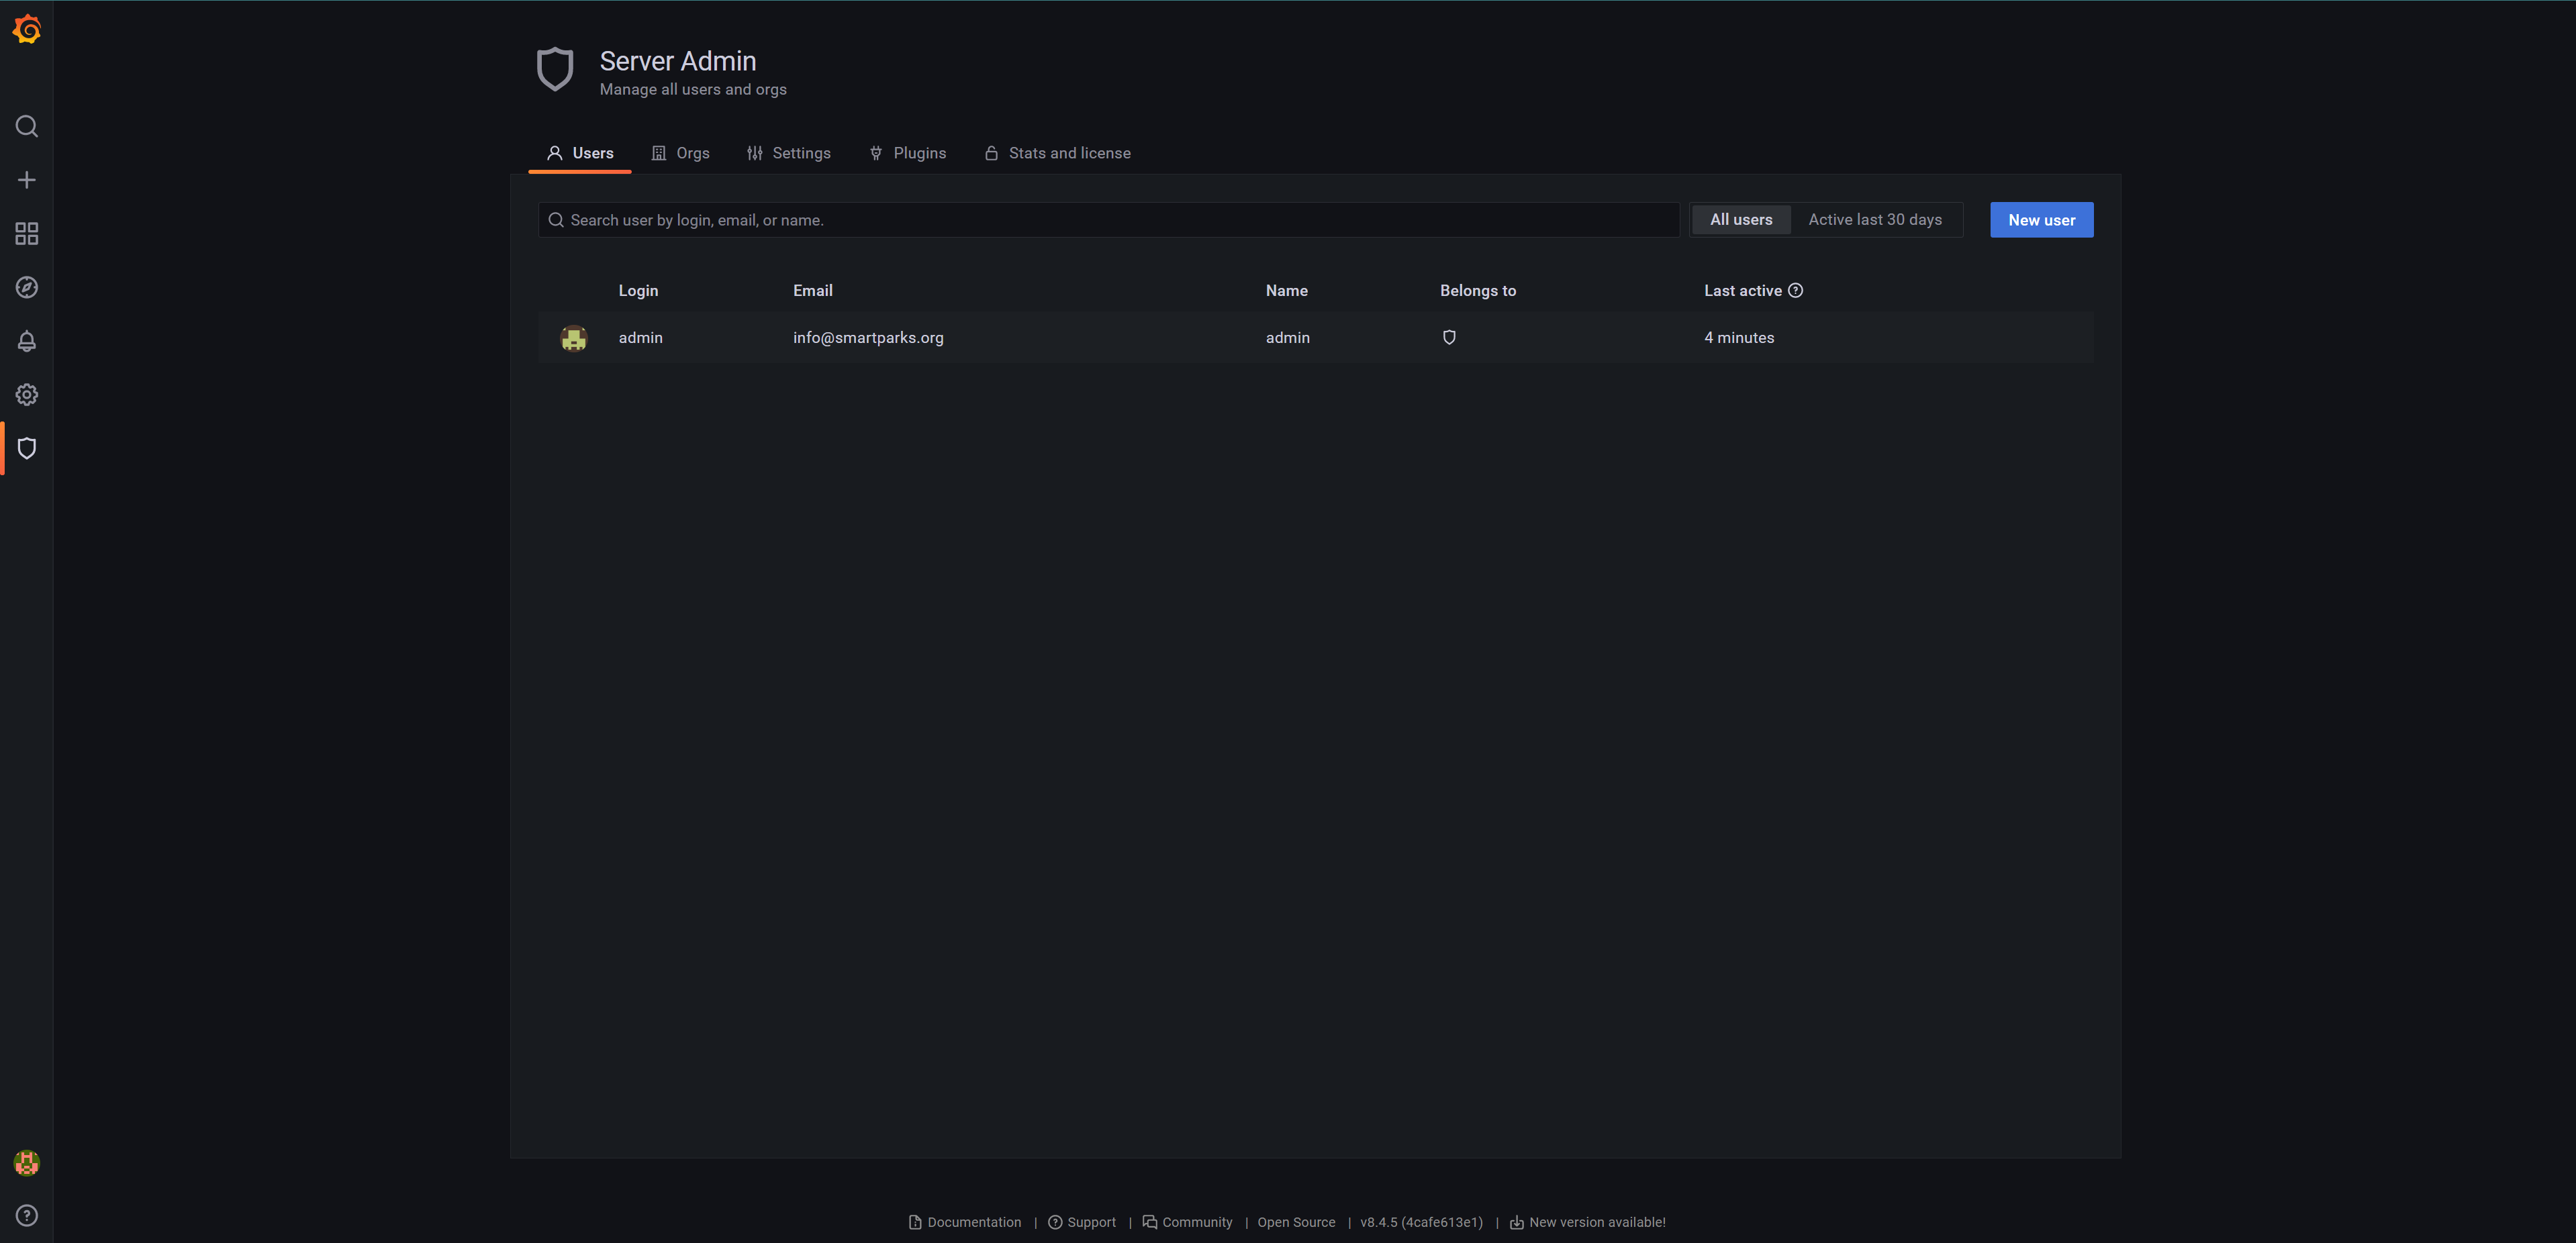
For security and convenience multiple users can be added to each organisation.
¶ Grafana - data export
¶ Data export to CSV
Each panel is using data that is queried from a data source. The data that is used for the panel can be exported to a CSV file using the standard data export feature of Grafana.
To facilitate the exporting of data we usually create a dedicated panel withing a dashboard. The export panel is generally a table that is showing all available data for the specific device selection.
The general steps to export data is as follows:
- Ensure the Export panel is queried with the needed device selection and timeline.
- Open the
Inspect > Datafunction from the top of the panel. - Ensure to select
Data options > Apply panel transformations. - Optional: select
Data options > Download for Excel. - Now hit the button
Download CSV.
A CSV file will be downloaded. Repeat this for the devices and date/time selection needed.